
Global Stock Market Returns in 2026: U.S., Europe and Asia Performance Compared
Global stock markets have produced dramatically different returns during 2026.
Some markets have delivered strong double-digit gains, particularly technology-heavy markets in Asia and the United States. Others have struggled because of high oil prices, foreign-investor withdrawals, weak earnings or domestic economic concerns.
This makes 2026 an important reminder that there is no single “global stock-market return.”
Performance depends heavily on the country, benchmark, sector composition and currency in which returns are measured.
As of August 21, 2026, the difference between some of the strongest and weakest major markets remains exceptionally wide.
Global Market Snapshot
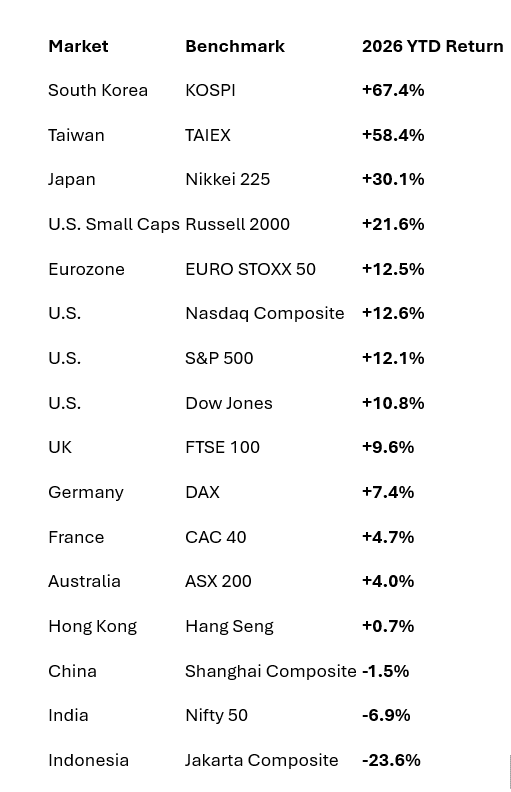
Approximate year-to-date index-price returns as of August 21, 2026 include:

These are price-index returns and can change every trading session. Different data vendors may produce slightly different numbers depending on closing dates and methodologies.
South Korea Has Been One of 2026's Biggest Winners
South Korea has experienced one of the most extraordinary stock-market cycles of the year.
The KOSPI was still approximately 67% higher YTD by August 21, despite suffering a roughly 30% decline from its June peak.
Earlier enthusiasm centred heavily on semiconductors and artificial-intelligence infrastructure.
Companies such as Samsung Electronics and SK Hynix benefited from expectations of enormous demand for advanced chips and memory used in AI systems.
However, the market's extreme volatility also demonstrates an important lesson:
A strong annual return can coexist with a severe correction.
Investors looking only at the +67% YTD figure would miss the significant losses suffered by investors who entered near the June peak.
Taiwan Remains an AI and Semiconductor Leader
Taiwan has also been one of the strongest markets.
The TAIEX was approximately 58% higher YTD by August 21.
Taiwan's equity market is heavily influenced by semiconductor companies and the global AI infrastructure cycle.
Demand for advanced chips, data-centre infrastructure and computing capacity helped drive substantial gains earlier in the year.
However, Taiwan also illustrates the risks of concentrated technology exposure.
Foreign investors withdrew approximately $22.95 billion from Taiwanese equities during July alone as concerns increased around AI spending and technology valuations.
Strong structural growth therefore does not eliminate short-term market risk.
Japan's Nikkei Has Delivered Strong Returns
Japan's Nikkei 225 closed at 66,016.36 on August 21, compared with 50,339.48 at the end of 2025.
That represents a gain of roughly 30% during 2026.
The Nikkei reached levels above 72,000 during June before experiencing increased volatility later in the summer.
Japanese equities have benefited from corporate earnings, technology exposure and continued changes in corporate governance.
But rising Japanese government-bond yields and concerns about monetary-policy normalisation have become increasingly important.
Japan therefore shows how equities can remain strongly positive even while interest-rate risks increase.
U.S. Markets Remain Positive
The United States has also delivered solid gains.
As of August 21:
- Russell 2000: +21.6%
- Nasdaq: +12.6%
- S&P 500: +12.1%
- Dow Jones: +10.8%
Artificial intelligence remains an important driver, particularly for technology and semiconductor companies.
However, one interesting development is that the Russell 2000 has outperformed the major large-cap indices, suggesting that market participation has broadened beyond the largest technology companies.
Strong corporate earnings have provided support.
But rising U.S. Treasury yields, high valuations and extraordinary AI capital expenditure have increased investor scrutiny.
This means the U.S. market is increasingly transitioning from an AI excitement story to an AI profitability story.
Europe Has Been More Resilient Than Expected
European markets have also delivered positive returns despite geopolitical and energy risks.
The broad STOXX Europe 600 remains close to historical highs and has gained approximately 10% during 2026.
Individual benchmarks show meaningful differences:
EURO STOXX 50: approximately +12.5%
FTSE 100: approximately +9.6%
DAX: approximately +7.4%
CAC 40: approximately +4.7%
Europe has benefited from stronger-than-expected earnings, relatively attractive valuations and greater exposure to financials, industrials and energy companies.
The STOXX 600 was trading at a significant valuation discount to U.S. equities while second-quarter corporate earnings were expected to rise approximately 24%.
However, rising crude oil prices and bond yields remain major risks.
India Has Under performed in 2026
India is one of the more notable laggards.
The Nifty 50 closed at 24,252 on August 21 and was approximately 6.9% lower YTD based on year-end comparison data.
Reuters' August 19 calculation placed Nifty's YTD decline closer to 7.9%, illustrating how small methodological and timing differences can occur between data providers.
The important point is the same: India has substantially under performed several other major Asian markets during 2026.
Several factors have contributed.
Foreign investor selling
Foreign investors have withdrawn tens of billions of dollars from Indian equities during 2026.
Oil prices
India imports much of its crude requirements, making higher energy prices a significant economic risk.
Global bond yields
Higher U.S. yields can make emerging-market equities less attractive to international investors.
Valuations
Indian equities entered the year at relatively high valuations compared with several competing markets.
Sector performance
Financials and IT, which carry substantial weights in major Indian indices, have experienced periods of weakness.
However, corporate earnings have recently strengthened, providing some potential fundamental support.
China Has Been Relatively Flat
China's Shanghai Composite has remained close to flat or slightly negative for 2026, at approximately -1.5% YTD by August 21.
This is a major contrast with technology-heavy South Korea and Taiwan.
Chinese equities continue to face uncertainty around:
- domestic consumption;
- the property market;
- government stimulus;
- corporate profitability; and
- global trade.
China's relatively modest market performance also highlights an important distinction:
economic growth and stock-market performance are not the same thing.
The IMF expects China to grow around 4.6% in 2026, but stock-market returns depend on valuations, profits and investor expectations as well as GDP.
Indonesia Has Been One of the Major Laggards
Indonesia's Jakarta Composite was approximately 23.6% lower YTD by August 21.
This is substantially better than the roughly -34.7% figure shown in your July 6 article, demonstrating why market-return pages require dated updates.
Emerging markets can be particularly sensitive to foreign-capital flows, currencies, commodity exposure and changes in global interest rates.
Indonesia's experience illustrates how quickly sentiment can shift even within a single year.
Why Are Global Returns So Different?
Several major forces explain the unusually wide return dispersion.
Artificial intelligence
Markets with strong semiconductor and technology exposure have generally benefited the most.
Oil prices
Energy producers and importers experience very different effects from rising crude prices.
Interest rates
Higher bond yields affect equity valuations and international capital flows.
Corporate earnings
Markets where profit growth has exceeded expectations have generally found greater support.
Valuations
A strong economy does not guarantee strong stock returns if investors already paid a very high valuation.
Currency movements
An international investor's actual return can differ substantially from the local-currency index return.
Local-Currency Returns Are Not the Same as Investor Returns
This is an important point missing from many global comparison tables.
Suppose Japan's Nikkei rises 30% in yen terms.
An Indian or U.S. investor's actual return may be different depending on how the yen moves against the rupee or dollar.
Likewise, an international investor buying Indian equities receives both:
the stock-market return
and
the currency impact.
Therefore, a global ranking based solely on local index returns provides useful information but does not represent the exact return earned by every investor.
Price Index vs Total Return Index
Another methodological point matters.
Most headline market indices are price indices.
They show changes in index prices but generally exclude reinvested dividends.
A Total Return Index includes dividends and therefore typically shows a higher long-term return.
When comparing global markets, investors should use the same methodology wherever possible.
Mixing a total-return index for one country with a price index for another can produce misleading comparisons.
2026 Has Been a Year of Extreme Dispersion
Perhaps the most important lesson from the table is the size of the gap between markets.
South Korea: around +67%
Taiwan: around +58%
Japan: around +30%
United States: approximately +11% to +22%, depending on the index
India: approximately -7%
Indonesia: approximately -24%
A difference of more than 90 percentage points separates some major markets.
That is extraordinary.
It demonstrates why diversification across countries and sectors can influence portfolio outcomes.
Does the Best Market of 2026 Become the Best Investment?
Not necessarily.
Historical return rankings describe what has already happened.
They do not tell investors what will happen next.
A market that has gained 60% can continue rising.
It can also experience a significant correction because expectations have become extremely optimistic.
Likewise, an underperforming market may remain weak or eventually recover.
Investors should therefore examine:
- earnings;
- valuation;
- interest rates;
- currencies;
- economic conditions;
- sector concentration; and
- risk
rather than simply buying whichever index currently sits at the top of a YTD table.
Final Takeaway
Global stock-market returns in 2026 have been unusually uneven.
Technology-heavy Asian markets such as South Korea and Taiwan have delivered some of the strongest gains, while Japan has also performed exceptionally well.
U.S. and European equities remain solidly positive.
India and Indonesia have significantly underperformed.
The main forces behind these differences include AI investment, semiconductor demand, crude-oil prices, interest rates, corporate earnings, valuations and foreign capital flows.
The lesson for investors is not that one country is permanently better than another.
It is that global market leadership changes over time.
Diversification and valuation discipline remain important precisely because the market that performed best last year—or even earlier this year—may not lead the next cycle.
Updated: August 22, 2026
Data note: YTD figures are approximate local-currency price-index returns primarily through August 21, 2026. Values change with each trading session and may vary slightly between data providers.
Disclaimer: This article is for educational and informational purposes only. Historical and year-to-date index performance does not predict future returns and should not be treated as investment advice or a recommendation to invest in any country, ETF or financial product.
Helpful Resources on LiveWorldMarket
Global Stock Markets in 2026 — broader explanation of the economic and market forces behind the regional performance differences.
Read Global Stock Markets in 2026
U.S. Stock Market Dashboard — live/current U.S. index data.
Open U.S. Stock Market Dashboard
Europe Stock Market Dashboard — current FTSE, DAX, CAC 40 and European-market data.
Open Europe Stock Market Dashboard
India Stock Market Dashboard — Nifty, Sensex, Bank Nifty, VIX and sector performance.
Open India Stock Market Dashboard
Asia Stock Market Dashboard — compare Japan, China, Hong Kong, South Korea, Taiwan and other major Asian markets.
Comments (0)
Be the first to comment.
About the author

NISM-Series-X-A Investment Adviser Level 1 examination completed
Amit writes about Indian equity markets, technical analysis, macro themes and the day-to-day mechanics of trading, with a focus on making the flow of global markets legible for retail investors. He has completed the NISM-Series-X-A Investment Adviser Level 1 examination.
You May Also Like

Investors Pour $44 Billion Into Stocks Despite 5% Bond Yields
Global Markets & Economy · Sep 27, 2026 · 11 min read
AI Stocks Keep Rising While Bond Yields Hit Multi-Decade Highs: Is the Stock Market Becoming Too Dependent on AI? Something unusual is happening across global financial markets. Bond investors are confronting some of the highest yields seen in decades. The U.S. 10-year Treasury yield has moved above 5%, longer-dated yields have climbed even further, and Japanese government…
Read more...
AI Stocks vs 5.2% Treasury Yields: Is the S&P 500 Too Dependent on AI?
Technology & Sectors · Sep 26, 2026 · 11 min read
AI Stocks Keep Rising While Bond Yields Hit Multi-Decade Highs: Is the Stock Market Becoming Too Dependent on AI? Something unusual is happening across global financial markets. Bond investors are confronting some of the highest yields seen in decades. The U.S. 10-year Treasury yield has moved above 5%, longer-dated yields have climbed even further, and Japanese government…
Read more...
Japan Bond Yields Surge: Could Japanese Money Leave Global Markets?
Fundamental · Sep 25, 2026 · 12 min read
Japan’s Bond Yields Are Surging: Could Trillions in Japanese Money Start Coming Home? For decades, Japan played an unusual but enormously important role in global financial markets. Interest rates at home were exceptionally low. Japanese banks, insurers, pension funds and other institutional investors therefore searched overseas for better returns. That helped direct enormous…
Read more...
U.S. 10-Year Yield Back Above 5%: Why Strong Growth Is Now a Risk for Stocks
Fundamental · Sep 24, 2026 · 12 min read
U.S. 10-Year Yield Is Back Above 5%—But This Time Strong Growth Is Driving It: Why That Matters for Stocks The U.S. 10-year Treasury yield is back above 5%. Normally, that headline alone would be enough to make equity investors nervous. But something important is different this time. Treasury yields are not rising only because investors are worried about inflation, oil prices…
Read more...
AI Agents Could Be the Next Catalyst for Semiconductor and Chip Stocks
Technology & Sectors · Sep 23, 2026 · 12 min read
AI Agents Are Becoming the New Catalyst for Chip Stocks: Why Consumer Adoption Could Matter More Than the Next Nvidia Earnings For most of the artificial-intelligence boom, investors have focused on one question: How much will technology companies spend on AI? That question helped drive enormous investment into GPUs, data centers, high-bandwidth memory, networking equipment…
Read more...
Trump-Xi Meeting: What It Could Mean for AI and Semiconductor Stocks
News · Sep 22, 2026 · 11 min read
Trump-Xi Meeting Could Be the Next Big Catalyst for AI and Semiconductor Stocks: What Global Markets Are Watching Artificial intelligence stocks are surging again. The Nasdaq has reached a record closing high, semiconductor stocks have jumped sharply, and enthusiasm around the next wave of AI investment is once again driving global technology markets. But the next major…
Read more...
Vietnam Joins Emerging Markets: Could a $6 Billion FTSE Upgrade Trigger the Next Big Asian Stock-Market Re-Rating?
Global Markets & Economy · Sep 21, 2026 · 9 min read
Vietnam has officially entered a new chapter in its stock-market development. On September 21, Vietnamese equities joined FTSE Russell's emerging-market indexes, moving the country further into the global institutional investment universe after years of market reforms. The change may appear technical, but its implications could be much larger. FTSE Russell estimates that the…
Read more...
Why Are Investors Pulling Billions From U.S. Stocks While the S&P 500 Barely Falls?
Fundamental · Sep 20, 2026 · 11 min read
Something unusual is happening underneath global stock markets. Investors withdrew $23.21 billion from global equity funds during the week ended September 16, the largest weekly outflow in nine months. The move was even more dramatic in the United States. U.S. equity funds recorded approximately $31.44 billion in withdrawals, marking a fourth consecutive week of outflows. Yet…
Read more...
AI Stocks Rebound After a Brutal Week: Is the Semiconductor Rally Strong Enough to Overcome 5% Treasury Yields?
Fundamental · Sep 19, 2026 · 12 min read
Key Takeaways AI and semiconductor stocks are rebounding, helping support the S&P 500 and Nasdaq after a volatile week. The U.S. 10-year Treasury yield recently crossed 5%, creating a much higher valuation hurdle for growth and technology stocks. AI infrastructure spending remains a major support for chip demand, extending beyond processors into memory, storage, networking and…
Read more...Gold Near $4,400 Despite Fed Rate Hikes: Why Is Gold Rising When Interest Rates Are Going Up?
Commodities & Energy · Sep 18, 2026 · 11 min read
Gold is doing something that may look unusual at first glance. The Federal Reserve has raised interest rates. U.S. Treasury yields remain historically elevated. The U.S. dollar has also been relatively strong. Normally, all three conditions can create pressure on gold. Yet gold has rebounded toward the $4,400-per-ounce area, keeping the precious metal close to historically…
Read more...