

Why Are Investors Pulling Billions From U.S. Stocks While the S&P 500 Barely Falls?
Something unusual is happening underneath global stock markets.
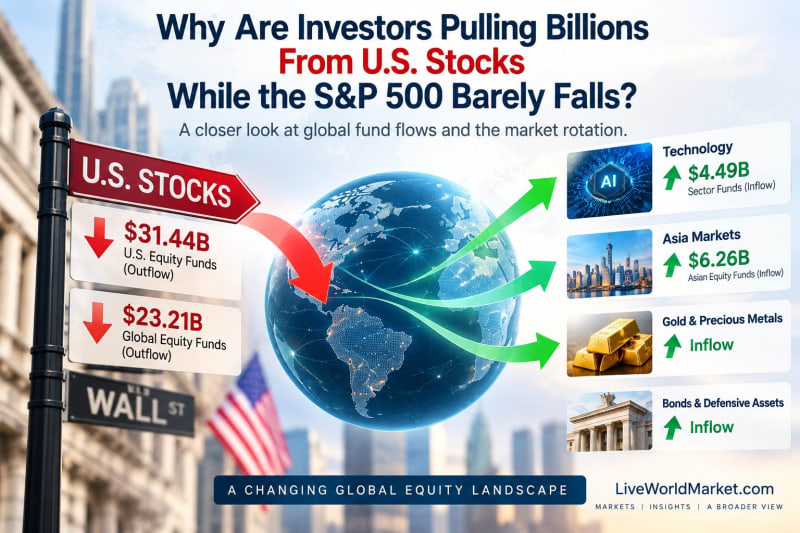
Investors withdrew $23.21 billion from global equity funds during the week ended September 16, the largest weekly outflow in nine months.
The move was even more dramatic in the United States.
U.S. equity funds recorded approximately $31.44 billion in withdrawals, marking a fourth consecutive week of outflows.
Yet the S&P 500 has not experienced anything resembling a comparable collapse.
Technology stocks remain relatively resilient. The Nasdaq continues to receive support from semiconductor and AI-related companies. And investors are still putting money into selected equity sectors.
So where is all the money going?
The latest fund-flow data suggests investors may not simply be abandoning stocks.
Instead, a potentially important global market rotation may be developing.
Money appears to be moving away from broad U.S. equity exposure and toward selected technology sectors, Asian markets, government bonds, gold and other defensive assets.
That creates an important question:
Are investors turning bearish on stocks—or simply becoming much more selective about where they take risk?
Global Equity Funds Just Recorded Their Biggest Outflow in Nine Months
The headline number deserves attention.
Global equity funds experienced approximately $23.21 billion of net withdrawals in the week ended September 16.
U.S. equity funds accounted for an even larger $31.44 billion outflow.
European equity funds also experienced modest withdrawals.
Several macroeconomic concerns are influencing investor positioning:
- crude oil remains above $100 a barrel
- inflation risks have increased
- the Federal Reserve has raised interest rates
- U.S. Treasury yields recently crossed 5%
- geopolitical uncertainty remains elevated
Normally, that combination might be expected to produce a much sharper equity-market decline.
Yet the market response has been surprisingly controlled.
Why Hasn't the S&P 500 Fallen Much More?
This is where the story becomes more interesting.
On Friday, the S&P 500 actually finished 0.17% higher, while the Nasdaq Composite gained approximately 0.40%.
The Dow declined modestly.
For the week, however, the picture was more mixed. The Dow suffered a considerably larger decline, while technology helped the Nasdaq remain comparatively resilient.
That tells us something important:
Fund outflows do not automatically translate into an equivalent decline in an index.
Several factors can explain why.
1. Investors Are Selling Some Stocks While Buying Others
The fund-flow data does not show investors abandoning every part of the equity market.
Quite the opposite.
While broad global equity funds experienced large withdrawals, equity sector funds attracted approximately $4.49 billion.
Technology, financials and consumer discretionary funds were among the beneficiaries.
That suggests the market may be experiencing a rotation rather than a complete risk-off event.
The distinction matters.
A traditional market selloff might look like:
Stocks → cash
The current environment appears more complicated:
Broad U.S. equities → selected sectors + Asia + bonds + gold
Investors are still willing to take risk.
They are simply becoming more selective.
2. Technology Is Helping Hold Up the Major Indices
Technology remains one of the strongest supports for U.S. equity benchmarks.
Friday provided a good example.
Semiconductor and optical-technology stocks helped the S&P 500 and Nasdaq recover from earlier weakness.
The semiconductor index gained even while much of the broader market struggled.
This matters because major U.S. indices are market-cap weighted.
Large technology companies therefore have a disproportionate influence on index performance.
A relatively small number of very large companies can push the S&P 500 higher even when hundreds of individual stocks are falling.
This helps explain the apparent contradiction:
Weak market underneath + resilient headline index.
Read AI Stocks Rebound After a Brutal Week: Is the Semiconductor Rally Strong Enough to Overcome 5% Treasury Yields? for a closer look at how semiconductor strength is supporting the broader market.
3. Market Breadth Is Sending a Different Signal
This is one of the most important indicators to watch.
An index tells investors what the overall benchmark is doing.
Market breadth tells investors how many stocks are actually participating.
Imagine the S&P 500 contains 500 companies.
If a handful of very large technology companies rise strongly while hundreds of smaller companies decline, the S&P 500 can still finish higher.
The headline may therefore say:
“S&P 500 rises.”
But underneath the surface:
Most stocks could be falling.
That appears to be an increasingly important feature of the current market.
On Friday, market breadth was weak during much of the session even as technology helped the major indices recover.
For investors, this makes breadth almost as important as the headline index level.
4. Why Are Investors Still Buying Technology?
The answer largely comes back to earnings growth.
Investors are operating in a difficult environment:
5% Treasury yields
higher interest rates
oil above $100
persistent inflation
and
geopolitical uncertainty.
In that environment, companies capable of producing strong earnings growth become particularly attractive.
Artificial intelligence remains one of the few areas generating exceptionally large capital-investment expectations.
Money continues flowing into:
- semiconductors
- AI infrastructure
- data centres
- cloud computing
- networking
- memory
- power infrastructure
- enterprise AI
That does not make technology immune to higher rates.
But it does help explain why investors may sell broad-market exposure while continuing to hold selected technology companies.
Read AI Stocks vs 5% Treasury Yields: Can the Global Tech Rally Continue? for the broader valuation debate.
5. Asia Is Attracting Money While U.S. Funds See Outflows
One of the most interesting numbers in the latest data comes from Asia.
While U.S. equity funds experienced approximately $31.44 billion in withdrawals, Asian equity funds attracted around $6.26 billion.
That does not necessarily mean investors are abandoning the United States for Asia.
But it does suggest investors may be looking for greater geographic diversification.
Several factors could contribute.
Valuation Differences
U.S. equities—particularly large technology companies—have experienced substantial valuation expansion.
Some Asian markets trade at lower valuation multiples.
Different Monetary Cycles
Interest-rate cycles are not identical across the global economy.
Different inflation and growth dynamics can create different opportunities.
Semiconductor Exposure
Asia remains central to global semiconductor manufacturing and the AI supply chain.
China
China's economy remains challenging, but Chinese asset valuations have already adjusted significantly in many areas.
Any meaningful improvement in growth expectations could attract tactical capital.
China Creates an Interesting Contradiction
The People's Bank of China has kept its benchmark lending rates unchanged.
China's one-year Loan Prime Rate remains at 3.00%, while the five-year rate remains at 3.50%.
Rates have now remained unchanged for an extended period despite weak domestic credit demand.
This creates an interesting contrast.
Investors are allocating money toward Asian equity funds even while parts of the Chinese economy remain weak.
That suggests the Asia allocation story may be broader than simply betting on a strong Chinese economic recovery.
Investors could instead be seeking:
- geographic diversification
- semiconductor exposure
- lower valuations
- currency opportunities
- different monetary-policy cycles
That makes Asian fund flows particularly important to monitor.
6. Gold Is Also Attracting Capital
Stocks are not the only destination.
Commodity funds attracted approximately $1.17 billion, with gold and precious-metals funds receiving significant inflows.
That is consistent with another unusual feature of the current market.
Investors appear willing to hold growth assets and defensive assets simultaneously.
A portfolio might therefore include:
AI and technology for growth
while also holding
gold for geopolitical and inflation protection.
This is not necessarily contradictory.
It can simply indicate unusually high uncertainty.
Read Gold Near $4,400 Despite Fed Rate Hikes: Why Is Gold Rising When Interest Rates Are Going Up? for more on why gold remains resilient despite higher interest rates.
7. Treasury Yields Are Changing Asset Allocation
The U.S. 10-year Treasury yield recently moved through the psychologically important 5% level.
That changes the asset-allocation equation.
Investors can now compare equities with government bonds offering historically attractive yields.
The question becomes:
Why take substantial stock-market risk if government bonds offer around 5%?
There is no universal answer.
Technology investors may believe AI companies can generate substantially higher returns.
More conservative investors may prefer government bonds.
Others may hold both.
The result can be money leaving broad equity funds without producing an outright market crash.
Instead, capital is redistributed across asset classes.
Read US 10-Year Treasury Yield Hits 5%: Why Rising Bond Yields Could Be the Next Risk for Global Stocks for more on this changing risk-reward equation.
Is This a Risk-Off Move or a Market Rotation?
This is the central question.
There are important differences between the two.
A Traditional Risk-Off Environment
Investors broadly sell:
- stocks
- high-yield bonds
- emerging-market assets
- speculative investments
and move toward:
- cash
- government bonds
- defensive currencies
- gold
A Market Rotation
Investors sell certain areas but continue buying others.
That is closer to what current fund flows appear to show.
Broad U.S. equity funds are losing money.
But technology sector funds are attracting capital.
Asian equities are receiving inflows.
Gold remains in demand.
Government and short-term bonds are attracting interest.
This looks less like investors abandoning financial markets and more like investors reallocating risk.
Why This Matters for the S&P 500
If money continues leaving broad U.S. equity funds while flowing into large technology companies, the S&P 500 could remain surprisingly resilient.
But that resilience comes with a potential weakness:
market concentration.
If fewer companies are responsible for keeping the index elevated, the market becomes increasingly dependent on those companies continuing to deliver.
That makes semiconductor and AI earnings particularly important.
If technology earnings remain strong, index resilience could continue.
But if technology leadership weakens while broader market breadth remains poor, the index could lose an important source of support.
The Market Could Be Entering a “Show Me the Earnings” Phase
For much of the AI rally, investors were willing to pay premium valuations for future growth.
The environment is changing.
When Treasury yields approach 5%, investors have an attractive alternative.
That means companies increasingly need to justify premium valuations with:
- revenue growth
- earnings growth
- margins
- free cash flow
- pricing power
- return on AI investment
This could create a much more selective stock market.
The next phase may therefore be less about:
Stocks vs bonds
and more about:
Which stocks can genuinely outperform bonds?
What Does This Mean for Indian Investors?
Global capital rotation matters for India as well.
India competes with other emerging markets for international investment.
If global investors reduce broad U.S. exposure and increase allocations toward Asia, some of those flows could eventually benefit Indian equities.
But India faces its own challenges.
Oil remains above $100.
Higher oil prices can affect:
- India's import bill
- inflation
- the rupee
- corporate margins
- government finances
At the same time, high U.S. Treasury yields can make dollar assets more attractive.
Indian markets therefore sit between two competing forces:
Potential global diversification toward Asia
versus
high oil prices and attractive U.S. bond yields.
That makes FII flows an important indicator to monitor.
Three Scenarios to Watch
Scenario 1: Rotation Broadens Beyond Technology
This would be constructive for markets.
Money begins flowing into industrials, financials, consumer companies and smaller stocks.
Market breadth improves.
The S&P 500 becomes less dependent on mega-cap technology.
That would suggest the rally is becoming healthier.
Scenario 2: Technology Keeps Rising but Breadth Remains Weak
The major indices could continue performing relatively well.
But concentration risk would increase.
Investors would need to monitor whether AI and semiconductor earnings remain strong enough to support elevated valuations.
Scenario 3: Technology Leadership Breaks
This would be the more difficult scenario.
If broad-market flows remain negative and technology also begins losing momentum, the S&P 500 could lose one of the primary forces currently supporting the index.
Market breadth would become particularly important in this scenario.
What Investors Should Monitor Next
Several indicators can help determine whether the current movement is a healthy rotation or the beginning of a broader risk reduction:
- weekly global equity fund flows
- U.S. equity fund flows
- Asian equity inflows
- technology sector fund flows
- S&P 500 market breadth
- equal-weight S&P 500 performance
- Nasdaq vs Dow performance
- U.S. 10-year Treasury yield
- gold fund flows
- semiconductor earnings
- FII flows into India
Readers can follow major U.S., Asian, European and Indian markets through the LiveWorldMarket Global Index & Futures Hub.
The Bigger Picture
The headline number is striking:
$23.21 billion left global equity funds in one week.
But the more important story may be where that money is going.
Investors are not simply moving everything into cash.
They appear to be making increasingly selective choices between:
U.S. equities
technology
Asian markets
government bonds
and
gold.
That could mark a transition toward a very different type of stock market.
Instead of nearly every asset rising together, investors may increasingly demand strong earnings, attractive valuations and clear fundamental reasons to own individual sectors and regions.
The most important question is therefore not simply:
“Why are investors selling stocks?”
It is:
“Where is global capital moving next?”
The answer could determine which markets and sectors lead the final months of 2026.
Related LiveWorldMarket Analysis
Read AI Stocks Rebound After a Brutal Week: Is the Semiconductor Rally Strong Enough to Overcome 5% Treasury Yields? for the technology leadership behind the current index resilience.
Explore AI Stocks vs 5% Treasury Yields: Can the Global Tech Rally Continue? for the broader valuation debate.
Read Gold Near $4,400 Despite Fed Rate Hikes: Why Is Gold Rising When Interest Rates Are Going Up? for the defensive side of current capital allocation.
Follow major international markets through the LiveWorldMarket Global Index & Futures Hub.
Disclaimer: This article is for informational and educational purposes only. Fund flows, financial markets and asset prices can change rapidly. Nothing in this article constitutes investment advice or a recommendation to buy or sell any security or financial instrument.
Comments (0)
Be the first to comment.
About the author

NISM-Series-X-A Investment Adviser Level 1 examination completed
Amit writes about Indian equity markets, technical analysis, macro themes and the day-to-day mechanics of trading, with a focus on making the flow of global markets legible for retail investors. He has completed the NISM-Series-X-A Investment Adviser Level 1 examination.
You May Also Like

AI Stocks Rebound After a Brutal Week: Is the Semiconductor Rally Strong Enough to Overcome 5% Treasury Yields?
Fundamental · Sep 19, 2026 · 12 min read
Key Takeaways AI and semiconductor stocks are rebounding, helping support the S&P 500 and Nasdaq after a volatile week. The U.S. 10-year Treasury yield recently crossed 5%, creating a much higher valuation hurdle for growth and technology stocks. AI infrastructure spending remains a major support for chip demand, extending beyond processors into memory, storage, networking and…
Read more...Gold Near $4,400 Despite Fed Rate Hikes: Why Is Gold Rising When Interest Rates Are Going Up?
Commodities & Energy · Sep 18, 2026 · 11 min read
Gold is doing something that may look unusual at first glance. The Federal Reserve has raised interest rates. U.S. Treasury yields remain historically elevated. The U.S. dollar has also been relatively strong. Normally, all three conditions can create pressure on gold. Yet gold has rebounded toward the $4,400-per-ounce area, keeping the precious metal close to historically…
Read more...Fed Signals Rates Could Stay Around 4% Through 2027: Is ‘Higher for Longer’ Becoming a Bigger Risk Than Another Rate Hike?
Central Banks & Rates · Sep 17, 2026 · 8 min read
The Federal Reserve has raised interest rates again, but the latest quarter-point increase may not be the most important message for global financial markets. The bigger issue is how long borrowing costs could remain elevated. On September 16, 2026, the Federal Reserve raised the federal funds target range by 25 basis points to 3.75%–4.00%, marking its first rate increase…
Read more...US 10-Year Treasury Yield Hits 5%: Why Rising Bond Yields Could Be the Next Risk for Global Stocks
Global Markets & Economy · Sep 15, 2026 · 8 min read
The U.S. 10-year Treasury yield has crossed the psychologically important 5% level, putting global bond markets—and increasingly equity investors—on alert. On September 15, the benchmark yield climbed to around 5.03%, its highest level since 2007. The move comes as investors confront a difficult combination of higher oil prices, renewed inflation concerns, expectations of…
Read more...China’s Yuan Near a Four-Year High While Credit Demand Weakens: What It Means for Global Stocks
Global Markets & Economy · Sep 14, 2026 · 13 min read
China is sending global investors two very different economic signals. On one side, the Chinese yuan has strengthened significantly, rising around 4.3% this year and trading close to a four-year high against the U.S. dollar. On the other, China’s latest lending data suggests households and businesses remain cautious about borrowing. Chinese banks extended only 60 billion yuan…
Read more...Europe’s Natural Gas Problem Is Returning: Could Higher Energy Prices Hit European Stocks Again?
News · Sep 14, 2026 · 14 min read
Europe’s energy story is becoming important for financial markets again. For much of the recent market discussion, investors have focused on crude oil, U.S. interest rates and artificial intelligence. But another energy market is quietly becoming more important for Europe: natural gas. European policymakers are becoming increasingly concerned that higher natural gas and…
Read more...US Dollar at a Two-Week High: Why a Strong Dollar Could Become the Next Risk for Global Stocks
News · Sep 14, 2026 · 14 min read
The U.S. dollar is strengthening again, adding another important variable to an already complicated global-market environment. On September 14, the dollar climbed to a two-week high as investors responded to higher inflation expectations, elevated bond yields, geopolitical uncertainty and growing expectations that the U.S. Federal Reserve will raise interest rates this week…
Read more...AI Safety Concerns Hit Global Tech Stocks: Is the AI Rally Entering a More Selective Phase?
News · Sep 14, 2026 · 14 min read
Artificial intelligence has been one of the most powerful investment themes driving global stock markets in recent years. Semiconductor companies, cloud providers, data-centre operators and large technology businesses have invested enormous amounts of capital in the expectation that AI will transform how businesses and consumers use technology. But global markets were reminded…
Read more...Saudi Oil Pipeline Disruption: What It Could Mean for Crude Oil, Inflation and Global Markets
News · Sep 14, 2026 · 12 min read
Global energy markets are facing a fresh supply concern after Saudi Arabia temporarily shut its strategically important East-West oil pipeline following a drone attack. The pipeline matters far beyond Saudi Arabia. It carries crude from the kingdom's eastern production areas across the country to the Red Sea port of Yanbu, giving Saudi Arabia an alternative export route when…
Read more...S&P 500 Near Record Highs While Oil Is Above $100 and Yields Near 5% — Why Aren’t Stocks Falling?
Fundamental · Sep 13, 2026 · 14 min read
On paper, the current environment does not look particularly friendly for stocks. Crude oil is above $100 per barrel. The U.S. 10-year Treasury yield has moved close to 5%. Inflation remains a concern. Markets are debating whether the Federal Reserve could raise interest rates again. Geopolitical uncertainty continues to affect global energy markets. Yet U.S. equities remain…
Read more...