
Nifty 50 Was Roughly Flat for Two Years: What Long-Term Market Data Actually Tells Investors
Periods when the stock market appears to go nowhere can be surprisingly difficult for investors.
A sharp market fall creates obvious anxiety. A strong bull market creates excitement. But a market that spends months—or even years—around broadly similar levels creates a different problem: frustration.
That is roughly what Nifty 50 investors have experienced between August 2024 and August 2026.
The Nifty 50 was around 24,541 on 16 August 2024. By 17 August 2026, it closed at 24,287.65. On a price-index basis, that means the benchmark was roughly 1% below where it had been about two years earlier.
But describing that period simply as “two years with no return” misses an important distinction.
Price Return Is Not the Same as Investor Return
The commonly quoted Nifty 50 level is the Price Return Index (PRI).
It reflects changes in constituent share prices.
NSE also maintains a Total Return Index (TRI), which includes both price movement and dividends received from constituent companies, assuming those dividends are reinvested.
Therefore, saying:
“Nifty gave zero return for two years”
can be misleading.
A more accurate statement is:
The Nifty 50 Price Return Index was broadly flat over roughly two years.
Investors tracking the Total Return Index would have had some contribution from dividends even while the headline index level remained broadly unchanged.
This distinction becomes increasingly important over longer investment periods.
Why Can an Index Stay Flat for So Long?
An index can spend years consolidating even while the underlying economy and companies continue to evolve.
Several forces can produce this situation.
Stock prices may have risen ahead of earnings in an earlier bull market, leaving valuations elevated. Earnings can then grow while prices consolidate, allowing valuations to normalize.
Different sectors can also move in opposite directions. Financial stocks may perform well while technology, energy or consumer stocks struggle. Because Nifty 50 is weighted by free-float market capitalization, weakness in a few large constituents can offset strength elsewhere.
Investor expectations also matter.
A company can report higher earnings and still see its share price remain flat if those earnings were already reflected in the valuation.
This is why a flat index does not necessarily imply that nothing is happening underneath the surface.
Nifty 50 Is a Broad Benchmark, Not a Single Company
The Nifty 50 consists of 50 large and liquid Indian companies spanning important sectors of the economy. As of March 2026, the index represented about 53.73% of the free-float market capitalization of stocks listed on NSE.
Its composition also changes over time.
Companies enter and leave the index, sector weights shift and the businesses carrying the greatest influence on the benchmark evolve.
That means comparing today's Nifty 50 with the index of 10 or 20 years ago does not mean comparing an identical portfolio of companies.
The index itself adapts with India's listed corporate sector.
So What Does History Actually Tell Us?
The useful question is not:
“Did Nifty rise after the last time it stayed flat for two years?”
That approach can easily lead to cherry-picked conclusions.
A stronger way of studying history is to examine rolling returns across thousands of different starting dates.
NSE Indices has done exactly that.
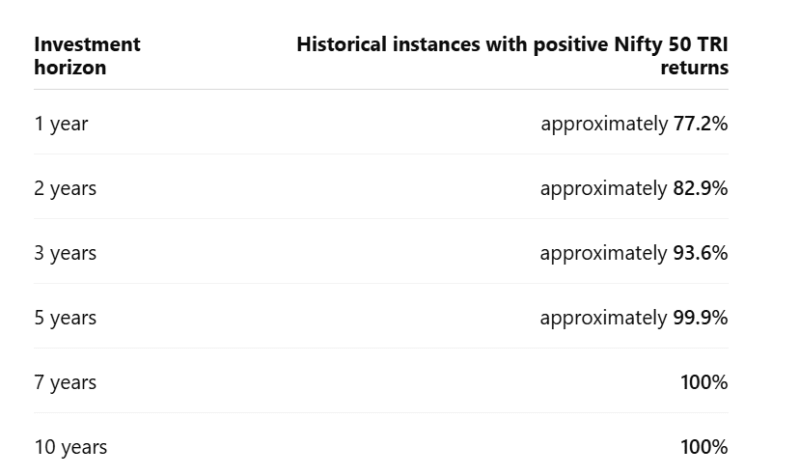
Its Nifty 50 whitepaper examined daily rolling Total Return Index observations from 30 June 1999 through 30 June 2025.
The results show how investment outcomes historically changed as holding periods increased.
Investment horizon Historical instances with positive Nifty 50 TRI returns

Source: NSE Indices, Nifty 50 Whitepaper 2025. Analysis period: 30 June 1999 to 30 June 2025; based on Nifty 50 Total Return Index values.
These numbers are historical observations—not promises about the future.
But they demonstrate something important.
Investment Horizon Has Historically Mattered More Than One Particular Starting Year
Short investment periods have produced a wide range of outcomes.
According to NSE Indices' rolling-return analysis, approximately 22.8% of historical one-year periods delivered negative Nifty 50 TRI returns.
For two-year periods, the proportion of negative historical observations fell to approximately 17.1%.
At three years it fell to about 6.4%, while negative five-year observations were extremely rare in the historical sample.
That does not mean a future five-, seven- or ten-year period cannot be negative.
Markets can behave differently from their past.
The useful lesson is narrower:
Historically, short-term outcomes have varied substantially, while longer holding periods reduced the frequency of negative Nifty 50 TRI outcomes in the observed dataset.
That is very different from saying:
“Nifty has been flat, therefore a rally must come next.”
There is no such guarantee.
Nifty's Long-Term History Has Included Several Long Consolidations
The history of Nifty 50 is not a smooth upward line.
The index has gone through the dot-com crisis, the global financial crisis, periods of policy uncertainty, commodity cycles, global interest-rate shocks and the COVID-19 market collapse.
NSE's long-term research shows significant draw downs as well as strong recoveries over the index's history.
Since June 1999 through June 2025, the Nifty 50 Total Return Index delivered an annualized return of about 14.04%, accompanied by annualized volatility of about 21.94%.
Those two numbers should be considered together.
Long-term returns did not arrive in a straight line.
They came with substantial volatility.
Calendar-Year Returns Tell the Same Story
The Nifty 50 TRI has historically produced many positive years, but negative years have also occurred.
NSE Indices reported that the Nifty 50 TRI in INR delivered positive returns in 22 out of 27 calendar-year observations in its dataset through the first half of 2025.
Some years produced very strong gains.
Others were nearly flat.
And major crises produced substantial declines.
This uneven distribution explains why investors can experience a frustrating two- or three-year period even when the much longer-term record looks attractive.
Long-term averages hide the journey required to earn them.
Does a Flat Two-Year Market Make the Next Rally More Likely?
Not automatically.
This is where historical analysis needs discipline.
An index remaining flat for two years does not mechanically cause future prices to rise.
Future returns depend on factors such as corporate earnings, valuations, interest rates, inflation, economic growth, liquidity, foreign and domestic institutional flows, commodity prices, currency movements and global risk appetite.
If company earnings rise significantly while index prices remain unchanged, valuations can become less demanding. That can potentially improve the starting point for future returns.
But this relationship is not guaranteed.
Conversely, if earnings expectations deteriorate, an index that already looks “flat for two years” can still fall further.
Price stagnation alone is therefore not a forecasting model.
The Starting Valuation Matters
Consider two hypothetical situations.
In the first, an index trades at a high valuation, remains flat for two years and corporate earnings grow strongly during that period.
Even without a higher index level, the valuation multiple may have fallen.
In the second situation, the index stays flat because earnings are also stagnant.
Those two markets may look identical on a two-year price chart but have very different underlying fundamentals.
This is why investors should examine both price and earnings, rather than concluding that time alone makes an index cheap.
Flat Markets Can Still Contain Significant Stock and Sector Movement
The Nifty 50 level is an aggregate.
During a period when the index itself changes very little, individual stocks and sectors can deliver dramatically different results.
Some companies may compound earnings.
Others may suffer declining profitability.
New businesses may enter the benchmark while weaker constituents leave.
Sector leadership can also change.
This means an apparently uneventful index can hide significant activity beneath the surface.
For long-term investors, understanding what is happening inside the benchmark can therefore be as important as watching the headline index level.
Why Sideways Markets Feel Worse Than They Look
There is also a behavior component.
When equities remain flat while gold, fixed deposits, international equities or another asset class is performing strongly, investors naturally compare returns.
This can produce recency bias—the tendency to assume that the asset class performing best today will continue performing best.
It can also create performance chasing.
Money may move from an under performing asset after a weak period into an asset that has already produced strong returns.
That decision can sometimes mean selling one asset after disappointing performance and buying another after substantial appreciation.
A diversified asset-allocation framework is designed partly to reduce dependence on making those timing decisions correctly.
What Should Investors Take From the Current Two-Year Period?
The most important lesson is not that Nifty 50 is “due” for a rally.
Markets do not owe investors returns because a certain amount of time has passed.
Instead, the current period provides three useful reminders.
First, equity returns are uneven. Strong long-term averages can contain lengthy periods of weak or negligible price appreciation.
Second, price return and total return are different. Dividends should be considered when evaluating long-term index performance.
Third, investment horizon matters. NSE's historical rolling-return study shows that the frequency of negative outcomes declined significantly as holding periods increased in the historical sample.
None of those observations predicts what Nifty will do next month or next year.
They simply provide context for understanding how equity-market returns have historically behaved.
What History Cannot Tell Us
Historical data cannot tell investors:
the exact level at which Nifty will trade next year;
whether the next market move will be higher or lower;
when the next bull market will begin;
whether a past pattern will repeat;
or what return investors will earn from today's starting level.
Historical statistics describe what happened in the sample being studied.
They are not probabilities guaranteed to apply to the future.
That distinction is particularly important when charts or social-media posts say things such as:
“Every time this happened, the market rallied next.”
A small number of historical examples can create a compelling chart while providing very little statistical evidence.
A Better Framework for Looking at Nifty Today
Rather than asking whether two years of flat performance guarantees a rebound, investors can monitor a broader set of variables.
The first is earnings growth—whether profits of Nifty companies are expanding.
The second is valuation—what investors are paying for those earnings.
The third is interest rates and inflation, which influence the relative attractiveness of equities and fixed-income assets.
The fourth is market breadth—whether gains are concentrated in a few companies or spread across sectors.
Finally, global variables such as crude oil prices, currencies, foreign flows and international risk sentiment can have meaningful effects on Indian equities.
Taken together, these factors provide a more useful framework than simply counting how many months the index has remained sideways.
Key Takeaway
The Nifty 50 Price Return Index was broadly unchanged between mid-August 2024 and mid-August 2026.
That can understandably feel disappointing to investors.
But history does not establish that two flat years must be followed by a strong rally.
What the longer Nifty 50 record does show is that returns have historically been uneven and that, in NSE Indices' rolling-return dataset, the frequency of negative outcomes declined as the investment horizon became longer.
For investors, the better question therefore isn't:
“What will happen because Nifty has been flat for two years?”
It is:
“Are my expectations, investment horizon and asset allocation appropriate for an asset class whose returns can arrive unevenly over time?”
That is a question history can help put into perspective—even though it cannot predict what the market will do next.
Data Sources & Methodology
NSE Indices Limited: Nifty 50 Whitepaper 2025; Nifty 50 historical and rolling Total Return Index analysis through 30 June 2025.
NSE / NSE Indices: Nifty 50 index methodology, historical data and distinction between Price Return and Total Return Index.
Market-level comparison: Mid-August 2024 and mid-August 2026 Nifty 50 Price Return Index levels are used only to illustrate the broad two-year price consolidation.
Historical results are not adjusted here to create a forecast of future Nifty returns. No claim is made that a previous market pattern must repeat.
Editorial Note
Last reviewed: 18 August 2026
Content type: Market education / Historical analysis
Benchmark: Nifty 50
Historical return framework: Nifty 50 Total Return Index where explicitly stated
Disclaimer
This article is provided solely for educational and informational purposes. It does not constitute investment advice, investment research, a recommendation, a price target or a solicitation to buy or sell any security, index fund or other financial product.
Historical market performance does not guarantee future results. Equity markets can experience prolonged periods of negative or flat returns, and investors can lose money. Investment decisions should consider individual goals, financial circumstances, risk tolerance and investment horizon.
Comments (0)
Be the first to comment.
About the author

NISM-Series-X-A Investment Adviser Level 1 examination completed
Amit writes about Indian equity markets, technical analysis, macro themes and the day-to-day mechanics of trading, with a focus on making the flow of global markets legible for retail investors. He has completed the NISM-Series-X-A Investment Adviser Level 1 examination.
You May Also Like
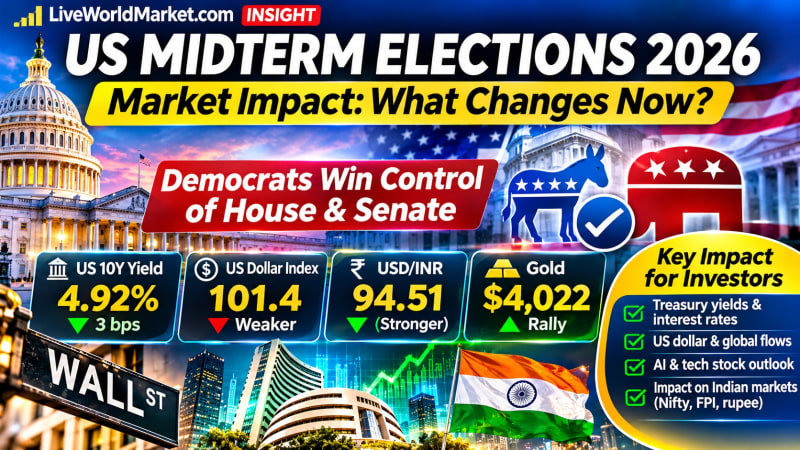
US Midterm Elections 2026: Impact on Stocks, Dollar & India
Global Markets & Economy · Nov 4, 2026 · 10 min read
US Midterm Elections 2026: Why Treasury Yields, the Dollar and Indian Stocks Could React More Than Wall Street Key Takeaway: Democrats have won control of both chambers of the US Congress in the 2026 midterm elections, creating a divided government under President Donald Trump. The immediate market reaction has been revealing: US Treasury yields declined, the dollar weakened…
Read more...
Apple Overtakes Nvidia: Is Lower AI Spending Winning?
Technology & Sectors · Nov 2, 2026 · 9 min read
Apple Overtakes Nvidia as World's Most Valuable Company Ahead of Earnings: Is Spending Less on AI Becoming Wall Street's Winning Strategy? Key takeaway: Apple has reclaimed the title of the world's most valuable publicly traded company, overtaking Nvidia as investors reassess the enormous cost of artificial intelligence infrastructure. With Apple's upcoming earnings in focus…
Read more...
ExxonMobil Refining Profits Surge: Impact on Indian Oil Stocks
Commodities & Energy · Nov 1, 2026 · 8 min read
ExxonMobil's Refining Profits Overtake Oil Drilling for First Time in 6 Years: Why India's Oil Stocks May Miss the Windfall Key Takeaway: ExxonMobil's refining business has emerged as a bigger earnings contributor than oil production, highlighting an extraordinary shift in global energy markets. But Indian oil companies such as IOC, BPCL and HPCL face a different challenge…
Read more...
Fed Decision and Microsoft–Google Earnings: Two Critical Tests for the AI Stock Market Rally
Global Markets & Economy · Oct 28, 2026 · 15 min read
Global stock markets are approaching one of the most important financial evenings of October 2026. The U.S. Federal Reserve is preparing to announce its latest interest-rate decision, while Microsoft and Alphabet, Google's parent company, are scheduled to publish quarterly earnings after Wall Street closes. These developments arrive as investors reassess the sustainability of…
Read more...
JetBlue Stock Surges 20%, Bond Yield Tops 30%: Warning?
Global Markets & Economy · Oct 28, 2026 · 16 min read
JetBlue Stock Surges 20% While Its Bonds Yield Over 30%: Is Airline Debt Flashing a Warning for Investors? Something unusual is happening in the U.S. airline industry. Shares of JetBlue Airways surged approximately 20% on October 27, after the airline raised its revenue outlook and attempted to reassure investors about its financial position. But an entirely different story…
Read more...
US Consumer Staples Rally 9.6%: FMCG Valuation Risk for India
Global Markets & Economy · Oct 25, 2026 · 16 min read
US Consumer Staples Surge 9.6% as Valuations Overtake Tech: Is the Safe-Stock Trade Becoming a Trap for Indian FMCG Investors? Something unexpected is happening on Wall Street. As investors become increasingly cautious about expensive artificial intelligence stocks, money has been moving into an unlikely market leader: consumer staples. The U.S. consumer-staples sector has…
Read more...
SpaceX 80,000 Cell Sites: Will Starlink Challenge Jio & Airtel?
Global Markets & Economy · Oct 24, 2026 · 17 min read
SpaceX's 80,000 Cell-Site Plan Sends US Telecom Stocks Down 8%: Could Starlink Disrupt Jio and Airtel Next? A major shift may be emerging in the global telecommunications industry—and Wall Street has already started reacting. Shares of American telecommunications giants AT&T and T-Mobile plunged nearly 8% on October 23 after reports revealed that Elon Musk's SpaceX was…
Read more...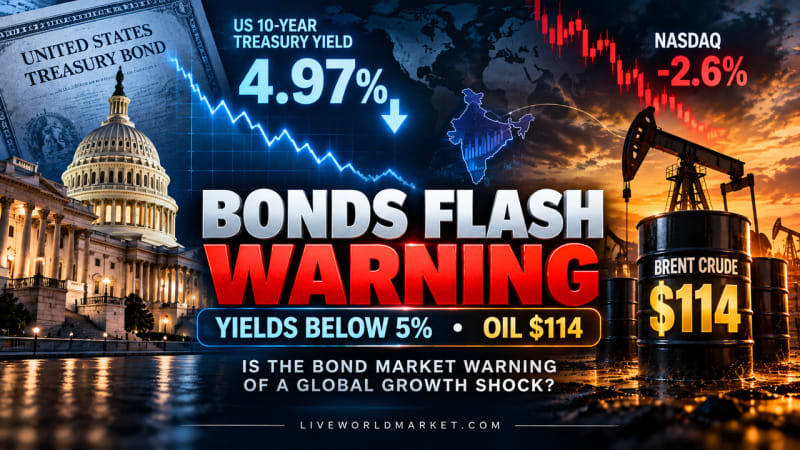
US 10-Year Treasury Yield Below 5%: Growth Shock Warning?
Central Banks & Rates · Oct 23, 2026 · 17 min read
US 10-Year Treasury Yield Falls Below 5% Despite $114 Oil: Is the Bond Market Warning of a Global Growth Shock? Something unusual is happening across global financial markets. The yield on the benchmark U.S. 10-year Treasury has fallen sharply below the psychologically important 5% level, even as Brent crude oil has surged toward $114 per barrel and technology stocks have…
Read more...
Brent Crude Tops $110: Impact on Indian Stocks & Earnings
Global Markets & Economy · Oct 22, 2026 · 14 min read
Brent Crude Tops $110: Why Indian Airlines, Paints and Tyre Stocks Face a Hidden Earnings Risk Brent crude oil has climbed above $110 per barrel, intensifying concerns that rising global energy prices could squeeze corporate profit margins, increase India's import costs and create further volatility in domestic equities. On October 22, Brent futures traded above $111 after…
Read more...
India Optical Fibre Exports Jump 158%: AI's Hidden Winners
Global Markets & Economy · Oct 21, 2026 · 12 min read
India's Optical Fibre Exports Jump 158% as Japan's Chip Shipments Surge 49%: The Hidden Winners of the AI Infrastructure Boom Artificial intelligence may be transforming the technology industry, but some of its most important economic beneficiaries are not necessarily the companies developing AI models. They may be the businesses manufacturing the physical infrastructure that…
Read more...