
How to Trade Using the 20 EMA and MACD Centerline Strategy
Technical indicators can make market charts easier to understand, but no single indicator can predict every price movement. A practical approach is to combine one tool that identifies the prevailing trend with another that measures momentum.
The 20-period Exponential Moving Average, or 20 EMA, and the Moving Average Convergence Divergence, commonly known as MACD, can be used together for this purpose. The EMA provides a visual indication of short-term trend direction, while the MACD centerline helps traders assess whether momentum is broadly positive or negative.
This strategy should be treated as a structured decision-making framework—not a guaranteed trading system.
Understanding the 20 EMA
An exponential moving average calculates the average price over a selected number of periods while assigning greater importance to recent prices. As a result, it reacts more quickly to price changes than a simple moving average.
The 20 EMA is commonly used to observe short-term market direction:
- Price trading above a rising 20 EMA may indicate a positive short-term trend.
- Price trading below a falling 20 EMA may suggest a negative trend.
- A flat EMA with price repeatedly moving across it can indicate a sideways market.
The EMA should not be interpreted in isolation. Price can temporarily cross it because of volatility without establishing a sustainable trend.
Understanding the MACD centerline
The standard MACD calculation uses the difference between the 12-period and 26-period exponential moving averages. It generally contains a MACD line, a signal line and a histogram.
For this strategy, the most important reference is the zero or centerline:
- When the MACD line is above zero, the shorter-term EMA is above the longer-term EMA, indicating relatively positive momentum.
- When the MACD line is below zero, the shorter-term EMA is below the longer-term EMA, indicating relatively negative momentum.
- Repeated movement around zero may reflect uncertain or range-bound conditions.
A centerline crossover is different from a signal-line crossover. The centerline compares the MACD line with zero, whereas a signal-line crossover compares the MACD line with its signal line.
Potential bullish setup
A trader looking for a bullish setup may begin with the following conditions:
- Price is trading above the 20 EMA.
- The 20 EMA is rising rather than moving horizontally.
- The MACD line crosses above the zero line or remains firmly above it.
- Price forms a clear bullish candle or breaks a nearby resistance level.
- Trading volume supports the price movement, where volume data is available.
Instead of entering immediately after a temporary price spike, a trader may wait for the candle to close. This reduces the possibility of acting on an intraday crossover that disappears before the period ends.
A pullback towards the rising 20 EMA may also offer a more disciplined setup, provided price holds above the average and momentum remains positive.
Potential bearish setup
The same logic can be reversed when evaluating a bearish setup:
- Price is trading below the 20 EMA.
- The EMA has a visible downward slope.
- The MACD line crosses below zero or remains below the centerline.
- Price closes below a nearby support level or forms a bearish confirmation candle.
- Volume and broader market conditions support the move.
Traders should avoid treating every bearish crossover as an automatic short-selling opportunity. Short selling involves additional risks and may be subject to market-specific rules, margin requirements and intraday position-closing conditions.
Planning entries and exits
A trading plan should define the entry, stop-loss and exit conditions before an order is placed.
For a bullish setup, the stop-loss could be positioned below the recent swing low, below a clearly identified support level or at a volatility-adjusted distance. For a bearish setup, it may be placed above the recent swing high or resistance area.
Possible exit methods include:
- Closing the position when price crosses the 20 EMA in the opposite direction.
- Exiting when the MACD returns across the centerline.
- Using a predetermined risk-to-reward objective.
- Trailing the stop behind successive swing highs or lows.
- Taking partial profits while allowing the remaining position to follow the trend.
The chosen method should be tested consistently. Changing the exit rule during a trade can lead to emotional decision-making.
When the strategy may not work well
EMA and MACD are both derived from historical price information. Consequently, their signals can appear after a market move has already started.
The strategy may generate misleading signals when:
- The market is moving sideways.
- Price repeatedly crosses the 20 EMA.
- The MACD fluctuates around its centerline.
- A sudden news event causes unusually high volatility.
- The selected instrument has limited trading volume.
- The broader market trend conflicts with the individual setup.
Checking a higher timeframe can provide additional context. For example, a bullish setup on a 15-minute chart may be less reliable when the daily chart is in a strong downtrend.
Risk management matters more than the indicator
Even a well-defined setup can fail. Traders should therefore limit the amount of capital exposed to any single trade. Position size can be calculated using the difference between the planned entry and stop-loss levels.
Paper trading and historical testing can help identify how the method behaves across trending, sideways and volatile periods. Testing should include brokerage, taxes, slippage and other transaction costs because these expenses can materially affect results.
Final takeaway
The 20 EMA and MACD centerline strategy offers a simple way to combine trend and momentum. Its main strength is that it encourages traders to look for alignment rather than relying on one isolated indicator.
However, a crossover is only an observation—not a promise that price will continue in the same direction. Market structure, volume, volatility, position sizing and disciplined exits remain essential. Traders should evaluate the strategy independently and use only capital they can afford to place at risk.
Disclaimer: This article is intended solely for educational and informational purposes. It does not constitute investment advice, a trading recommendation, research analysis or an assurance of returns. Trading and investing involve the risk of financial loss. Readers should conduct independent research and consult a qualified financial professional where appropriate.
Comments (0)
Be the first to comment.
About the author

NISM-Series-X-A Investment Adviser Level 1 examination completed
Amit writes about Indian equity markets, technical analysis, macro themes and the day-to-day mechanics of trading, with a focus on making the flow of global markets legible for retail investors. He has completed the NISM-Series-X-A Investment Adviser Level 1 examination.
You May Also Like

Big Tech Gains $750B as AI Data Centre Stocks Crash
Global Markets & Economy · Nov 5, 2026 · 12 min read
Big Tech Gains $750 Billion After US Midterms, but AI Data-Centre Stocks Crash: Is Wall Street Rewarding Less AI Spending? Key Takeaway: Wall Street's reaction to the 2026 US midterm elections has exposed a surprising divide in the artificial intelligence investment boom. Established technology giants rallied, with five major companies on course to add more than $750 billion…
Read more...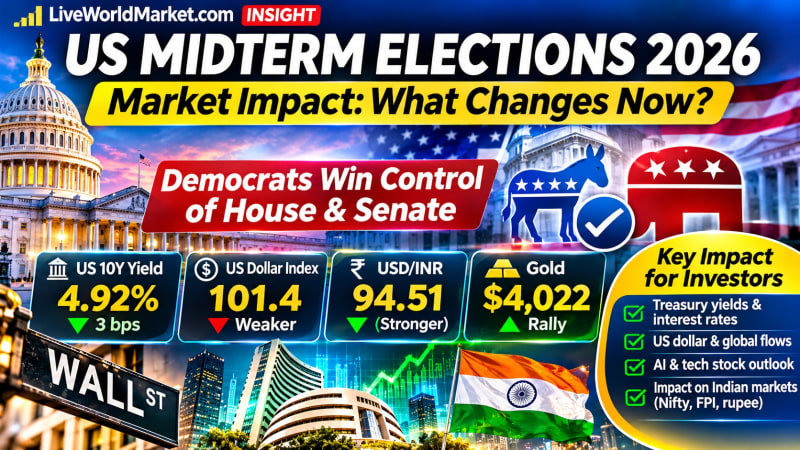
US Midterm Elections 2026: Impact on Stocks, Dollar & India
Global Markets & Economy · Nov 4, 2026 · 10 min read
US Midterm Elections 2026: Why Treasury Yields, the Dollar and Indian Stocks Could React More Than Wall Street Key Takeaway: Democrats have won control of both chambers of the US Congress in the 2026 midterm elections, creating a divided government under President Donald Trump. The immediate market reaction has been revealing: US Treasury yields declined, the dollar weakened…
Read more...
Apple Overtakes Nvidia: Is Lower AI Spending Winning?
Technology & Sectors · Nov 2, 2026 · 9 min read
Apple Overtakes Nvidia as World's Most Valuable Company Ahead of Earnings: Is Spending Less on AI Becoming Wall Street's Winning Strategy? Key takeaway: Apple has reclaimed the title of the world's most valuable publicly traded company, overtaking Nvidia as investors reassess the enormous cost of artificial intelligence infrastructure. With Apple's upcoming earnings in focus…
Read more...
ExxonMobil Refining Profits Surge: Impact on Indian Oil Stocks
Commodities & Energy · Nov 1, 2026 · 8 min read
ExxonMobil's Refining Profits Overtake Oil Drilling for First Time in 6 Years: Why India's Oil Stocks May Miss the Windfall Key Takeaway: ExxonMobil's refining business has emerged as a bigger earnings contributor than oil production, highlighting an extraordinary shift in global energy markets. But Indian oil companies such as IOC, BPCL and HPCL face a different challenge…
Read more...
Fed Decision and Microsoft–Google Earnings: Two Critical Tests for the AI Stock Market Rally
Global Markets & Economy · Oct 28, 2026 · 15 min read
Global stock markets are approaching one of the most important financial evenings of October 2026. The U.S. Federal Reserve is preparing to announce its latest interest-rate decision, while Microsoft and Alphabet, Google's parent company, are scheduled to publish quarterly earnings after Wall Street closes. These developments arrive as investors reassess the sustainability of…
Read more...
JetBlue Stock Surges 20%, Bond Yield Tops 30%: Warning?
Global Markets & Economy · Oct 28, 2026 · 16 min read
JetBlue Stock Surges 20% While Its Bonds Yield Over 30%: Is Airline Debt Flashing a Warning for Investors? Something unusual is happening in the U.S. airline industry. Shares of JetBlue Airways surged approximately 20% on October 27, after the airline raised its revenue outlook and attempted to reassure investors about its financial position. But an entirely different story…
Read more...
US Consumer Staples Rally 9.6%: FMCG Valuation Risk for India
Global Markets & Economy · Oct 25, 2026 · 16 min read
US Consumer Staples Surge 9.6% as Valuations Overtake Tech: Is the Safe-Stock Trade Becoming a Trap for Indian FMCG Investors? Something unexpected is happening on Wall Street. As investors become increasingly cautious about expensive artificial intelligence stocks, money has been moving into an unlikely market leader: consumer staples. The U.S. consumer-staples sector has…
Read more...
SpaceX 80,000 Cell Sites: Will Starlink Challenge Jio & Airtel?
Global Markets & Economy · Oct 24, 2026 · 17 min read
SpaceX's 80,000 Cell-Site Plan Sends US Telecom Stocks Down 8%: Could Starlink Disrupt Jio and Airtel Next? A major shift may be emerging in the global telecommunications industry—and Wall Street has already started reacting. Shares of American telecommunications giants AT&T and T-Mobile plunged nearly 8% on October 23 after reports revealed that Elon Musk's SpaceX was…
Read more...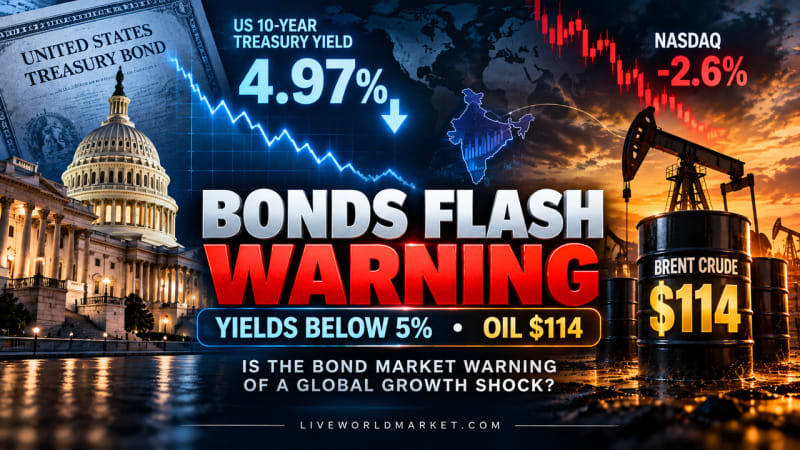
US 10-Year Treasury Yield Below 5%: Growth Shock Warning?
Central Banks & Rates · Oct 23, 2026 · 17 min read
US 10-Year Treasury Yield Falls Below 5% Despite $114 Oil: Is the Bond Market Warning of a Global Growth Shock? Something unusual is happening across global financial markets. The yield on the benchmark U.S. 10-year Treasury has fallen sharply below the psychologically important 5% level, even as Brent crude oil has surged toward $114 per barrel and technology stocks have…
Read more...
Brent Crude Tops $110: Impact on Indian Stocks & Earnings
Global Markets & Economy · Oct 22, 2026 · 14 min read
Brent Crude Tops $110: Why Indian Airlines, Paints and Tyre Stocks Face a Hidden Earnings Risk Brent crude oil has climbed above $110 per barrel, intensifying concerns that rising global energy prices could squeeze corporate profit margins, increase India's import costs and create further volatility in domestic equities. On October 22, Brent futures traded above $111 after…
Read more...