
The Four Stages of a Growth Stock Trend: A Simple Guide for Investors
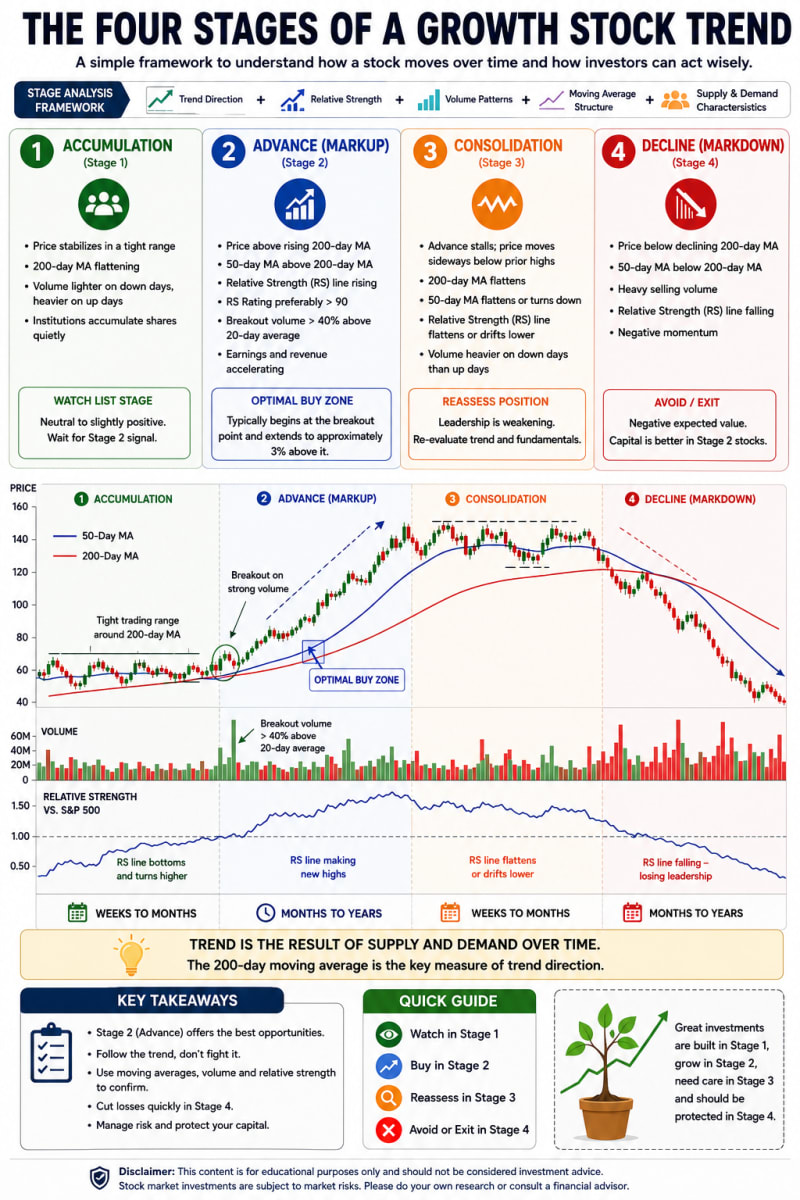
A strong stock does not move upward forever. Its price usually passes through different phases as buyers and sellers change their behaviour.
Understanding these phases can help investors identify when a stock may be preparing for an upward move, when the trend is strong, when momentum is weakening and when risk is increasing.
This method is often calledStage Analysis. It studies five main factors:
- Price direction
- Moving averages
- Trading volume
- Relative strength
- Demand and supply
Most growth-stock trends can be divided into four stages:Accumulation, Advance, Consolidation and Decline.

Stage 1: Accumulation
The accumulation stage usually begins after a stock has completed a long decline or has remained weak for several months.
During this phase, the stock price starts moving within a narrow range. It may not attract much public attention because there is no major upward movement yet.
However, experienced investors and institutions may slowly begin buying shares.
Common signs of the accumulation stage
The stock price generally moves sideways near the 200-day moving average. The 200-day moving average, which had previously been falling, starts becoming flat.
Trading volume may remain low on negative days but rise slightly on positive days. This can indicate that selling pressure is reducing and buyers are becoming more active.
The stock may appear boring during this phase, but it can be building a base for the next move.
What should investors do?
Stage 1 is normally awatchlist stage, not an immediate buying stage.
Investors can monitor the stock and wait for a clear breakout above its resistance level. Buying too early can result in money remaining stuck for weeks or months.
Stage 2: Advance or Markup
Stage 2 is the strongest phase of a growth-stock trend.
It begins when the stock breaks above its consolidation range with strong trading volume. The price starts making higher highs and higher lows.
The 50-day moving average moves above the 200-day moving average, while both averages begin rising.
Common signs of the advance stage
- Price remains above the rising 200-day moving average
- The 50-day moving average stays above the 200-day moving average
- Relative strength improves
- Breakouts are supported by high volume
- Earnings and revenue growth may accelerate
- The stock performs better than the broader market
The relative strength line is especially useful during this phase. A rising relative strength line means that the stock is outperforming a benchmark such as the Nifty 50, Sensex or S&P 500.
Where is the ideal buying area?
The best buying opportunity often appears when the stock breaks above an important resistance level with strong volume.
A healthy breakout should ideally have volume significantly higher than its recent average. Investors should avoid chasing a stock after it has already moved too far above the breakout price.
A stock that is extended may temporarily fall or consolidate, even when its long-term trend remains positive.
Stage 3: Consolidation or Distribution
After a long upward trend, the stock may enter Stage 3.
The price stops making strong progress and begins moving sideways. It may repeatedly rise and fall within a broad range without creating sustainable new highs.
At first, this phase may look similar to a normal correction. However, it can also indicate that large investors are gradually selling their holdings.
Common signs of the consolidation stage
The 200-day moving average begins to flatten. The 50-day moving average may also flatten or turn downward.
The relative strength line may stop rising and begin drifting lower. The stock may experience heavier volume on negative days than on positive days.
Breakouts may fail quickly, and the stock may struggle to maintain leadership within its sector.
What should investors do?
Stage 3 is a time toreassess the position.
Investors should review the stock’s trend, earnings growth, valuation and business outlook. It may be sensible to reduce exposure when the stock repeatedly fails to make new highs or falls below important support levels.
Not every Stage 3 pattern leads to a major decline. Some stocks can consolidate and begin another upward move. However, investors should become more cautious because the risk is higher than it was during Stage 2.
Stage 4: Decline or Markdown
Stage 4 is the weakest phase of the stock trend.
The stock price falls below its 200-day moving average, and the moving average itself begins sloping downward.
The 50-day moving average generally moves below the 200-day moving average. This indicates that both the short-term and long-term trends have weakened.
Common signs of the decline stage
- Price stays below the falling 200-day moving average
- The 50-day moving average remains below the 200-day moving average
- Relative strength continues falling
- Negative days show heavy selling volume
- The stock makes lower highs and lower lows
- Recovery attempts fail near resistance levels
In this stage, sellers are stronger than buyers. Even apparently cheap valuations may not provide support because the market may expect weaker future earnings or slower business growth.
What should investors do?
Stage 4 stocks are generally best avoided until the trend improves.
Buying simply because a stock has fallen sharply can be risky. A low price does not always mean good value. A declining stock can continue falling much longer than expected.
Investors should wait for the stock to stop declining, form a new base and return to Stage 1 before considering a fresh opportunity.
Why the 200-Day Moving Average Is Important
The 200-day moving average is one of the most widely followed indicators for understanding the long-term trend.
When the stock trades above a rising 200-day moving average, demand is generally stronger than supply. This is considered favourable.
When the stock trades below a falling 200-day moving average, supply is stronger than demand. This is considered unfavourable.
However, the moving average should not be used alone. Investors should also study price structure, volume, relative strength and company fundamentals.
The Importance of Trading Volume
Volume shows how many shares are being traded.
A breakout with low volume may not have strong support. In comparison, a breakout with significantly higher-than-average volume suggests that large investors may be participating.
Similarly, repeated high-volume declines can signal institutional selling.
A simple rule is:
Price movement tells you what is happening, while volume helps explain the strength behind that movement.
How Relative Strength Helps
Relative strength compares a stock’s performance with a market index.
For example, a stock may rise by 5%, but if the overall market rises by 10%, the stock is actually underperforming.
A rising relative strength line shows that the stock is performing better than the market. This is usually a positive sign during Stage 2.
A falling relative strength line means the stock is losing market leadership. This often appears during Stage 3 and Stage 4.
Relative strength should not be confused with the Relative Strength Index, or RSI. Both are useful indicators, but they measure different things.
A Simple Example
Suppose a stock has been falling for several months. It later begins moving sideways near its 200-day moving average. This may be Stage 1.
After a few weeks, the stock breaks above resistance with strong volume. Its 50-day moving average rises above the 200-day moving average. This can mark the beginning of Stage 2.
The stock continues rising for several months but eventually stops making new highs. Volume increases during declines and relative strength weakens. This may indicate Stage 3.
Finally, the stock falls below its 200-day moving average, and both moving averages begin trending downward. It has likely entered Stage 4.
Final Thoughts
The four-stage framework gives investors a structured way to understand a stock’s complete market cycle.
Stage 1 is the preparation phase.
Stage 2 is the strongest growth phase.
Stage 3 is the warning and reassessment phase.
Stage 4 is the declining and high-risk phase.
The main objective is not to predict the exact bottom or top. It is to identify whether demand or supply is currently controlling the stock.
Investors generally find better opportunities in fundamentally strong companies entering or already trading in Stage 2. At the same time, they should use proper risk management because no technical pattern guarantees a successful trade.
Disclaimer: This content is for educational purposes only and should not be considered investment advice. Stock-market investments involve risk. Always conduct your own research or consult a qualified financial adviser before making an investment decision.
Comments (0)
Be the first to comment.
About the author

NISM-Series-X-A Investment Adviser Level 1 examination completed
Amit writes about Indian equity markets, technical analysis, macro themes and the day-to-day mechanics of trading, with a focus on making the flow of global markets legible for retail investors. He has completed the NISM-Series-X-A Investment Adviser Level 1 examination.
You May Also Like

Big Tech Gains $750B as AI Data Centre Stocks Crash
Global Markets & Economy · Nov 5, 2026 · 12 min read
Big Tech Gains $750 Billion After US Midterms, but AI Data-Centre Stocks Crash: Is Wall Street Rewarding Less AI Spending? Key Takeaway: Wall Street's reaction to the 2026 US midterm elections has exposed a surprising divide in the artificial intelligence investment boom. Established technology giants rallied, with five major companies on course to add more than $750 billion…
Read more...
US Midterm Elections 2026: Impact on Stocks, Dollar & India
Global Markets & Economy · Nov 4, 2026 · 10 min read
US Midterm Elections 2026: Why Treasury Yields, the Dollar and Indian Stocks Could React More Than Wall Street Key Takeaway: Democrats have won control of both chambers of the US Congress in the 2026 midterm elections, creating a divided government under President Donald Trump. The immediate market reaction has been revealing: US Treasury yields declined, the dollar weakened…
Read more...
Apple Overtakes Nvidia: Is Lower AI Spending Winning?
Technology & Sectors · Nov 2, 2026 · 9 min read
Apple Overtakes Nvidia as World's Most Valuable Company Ahead of Earnings: Is Spending Less on AI Becoming Wall Street's Winning Strategy? Key takeaway: Apple has reclaimed the title of the world's most valuable publicly traded company, overtaking Nvidia as investors reassess the enormous cost of artificial intelligence infrastructure. With Apple's upcoming earnings in focus…
Read more...
ExxonMobil Refining Profits Surge: Impact on Indian Oil Stocks
Commodities & Energy · Nov 1, 2026 · 8 min read
ExxonMobil's Refining Profits Overtake Oil Drilling for First Time in 6 Years: Why India's Oil Stocks May Miss the Windfall Key Takeaway: ExxonMobil's refining business has emerged as a bigger earnings contributor than oil production, highlighting an extraordinary shift in global energy markets. But Indian oil companies such as IOC, BPCL and HPCL face a different challenge…
Read more...
Fed Decision and Microsoft–Google Earnings: Two Critical Tests for the AI Stock Market Rally
Global Markets & Economy · Oct 28, 2026 · 15 min read
Global stock markets are approaching one of the most important financial evenings of October 2026. The U.S. Federal Reserve is preparing to announce its latest interest-rate decision, while Microsoft and Alphabet, Google's parent company, are scheduled to publish quarterly earnings after Wall Street closes. These developments arrive as investors reassess the sustainability of…
Read more...
JetBlue Stock Surges 20%, Bond Yield Tops 30%: Warning?
Global Markets & Economy · Oct 28, 2026 · 16 min read
JetBlue Stock Surges 20% While Its Bonds Yield Over 30%: Is Airline Debt Flashing a Warning for Investors? Something unusual is happening in the U.S. airline industry. Shares of JetBlue Airways surged approximately 20% on October 27, after the airline raised its revenue outlook and attempted to reassure investors about its financial position. But an entirely different story…
Read more...
US Consumer Staples Rally 9.6%: FMCG Valuation Risk for India
Global Markets & Economy · Oct 25, 2026 · 16 min read
US Consumer Staples Surge 9.6% as Valuations Overtake Tech: Is the Safe-Stock Trade Becoming a Trap for Indian FMCG Investors? Something unexpected is happening on Wall Street. As investors become increasingly cautious about expensive artificial intelligence stocks, money has been moving into an unlikely market leader: consumer staples. The U.S. consumer-staples sector has…
Read more...
SpaceX 80,000 Cell Sites: Will Starlink Challenge Jio & Airtel?
Global Markets & Economy · Oct 24, 2026 · 17 min read
SpaceX's 80,000 Cell-Site Plan Sends US Telecom Stocks Down 8%: Could Starlink Disrupt Jio and Airtel Next? A major shift may be emerging in the global telecommunications industry—and Wall Street has already started reacting. Shares of American telecommunications giants AT&T and T-Mobile plunged nearly 8% on October 23 after reports revealed that Elon Musk's SpaceX was…
Read more...
US 10-Year Treasury Yield Below 5%: Growth Shock Warning?
Central Banks & Rates · Oct 23, 2026 · 17 min read
US 10-Year Treasury Yield Falls Below 5% Despite $114 Oil: Is the Bond Market Warning of a Global Growth Shock? Something unusual is happening across global financial markets. The yield on the benchmark U.S. 10-year Treasury has fallen sharply below the psychologically important 5% level, even as Brent crude oil has surged toward $114 per barrel and technology stocks have…
Read more...
Brent Crude Tops $110: Impact on Indian Stocks & Earnings
Global Markets & Economy · Oct 22, 2026 · 14 min read
Brent Crude Tops $110: Why Indian Airlines, Paints and Tyre Stocks Face a Hidden Earnings Risk Brent crude oil has climbed above $110 per barrel, intensifying concerns that rising global energy prices could squeeze corporate profit margins, increase India's import costs and create further volatility in domestic equities. On October 22, Brent futures traded above $111 after…
Read more...