
Head and Shoulders Pattern Explained: A Simple Guide for Every Trader
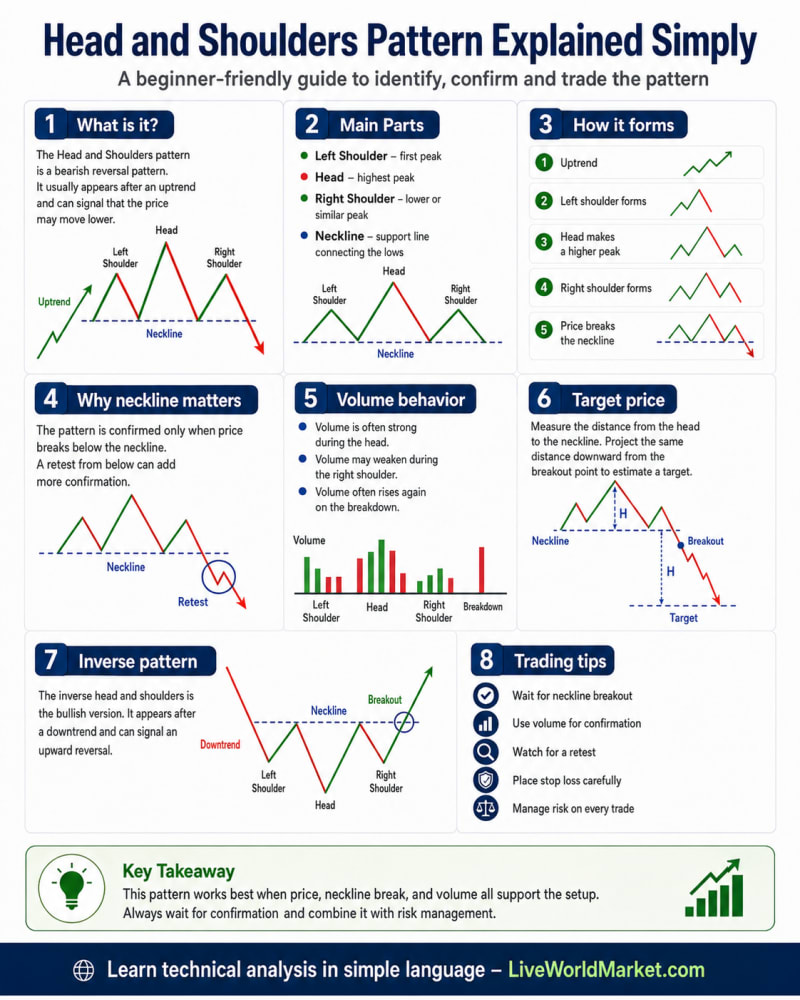
If you've ever looked at a stock chart and wondered how experienced traders identify trend reversals, theHead and Shoulders Pattern is one of the first chart patterns you should learn. It is easy to recognize and can help traders identify when an uptrend may be ending.
However, this pattern should never be used alone. It works best when combined with volume, support and resistance, and other technical indicators.

Let's understand it in simple language.
What Is the Head and Shoulders Pattern?
TheHead and Shoulders Pattern is abearish reversal pattern that usually appears after a strong uptrend.
It tells traders that buyers are gradually losing strength and sellers may soon take control.
The pattern gets its name because it looks like a person's head with two shoulders.
Once the price breaks below an important support level called theneckline, the pattern is considered complete.
The Four Parts of the Pattern
The Head and Shoulders pattern has four important parts.
1. Left Shoulder
The stock is in an uptrend and makes a new high.
After reaching that high, the price falls slightly.
This creates theLeft Shoulder.
2. Head
The buyers return and push the stock to a higher high.
This is the highest point of the pattern and is called theHead.
Again, the price falls after making this high.
3. Right Shoulder
The buyers try once more.
This time they fail to make a new high.
Instead, the stock forms a lower high or a high similar to the left shoulder.
This shows that buying momentum is becoming weaker.
4. Neckline
The neckline is the support line connecting the two important lows.
It is the most important level in the entire pattern.
Only when the stock closes below the neckline is the pattern confirmed.
How Does the Pattern Form?
The Head and Shoulders pattern usually develops in five simple steps.
Step 1: The stock is moving upward.
Step 2: The Left Shoulder forms after the first pullback.
Step 3: Buyers push the stock to a higher high, creating the Head.
Step 4: Buyers fail to make another higher high, creating the Right Shoulder.
Step 5: The price breaks below the neckline, confirming a possible trend reversal.
At this stage, many traders expect further downside.
Why Is the Neckline So Important?
Many beginners enter a trade as soon as they see the shape.
This is one of the biggest mistakes.
The pattern isnot confirmed until the neckline breaks.
A strong close below the neckline indicates that sellers have taken control.
Sometimes the price comes back to test the neckline again before continuing lower.
This is called aneckline retest and often provides additional confirmation.
What Does Volume Tell You?
Volume plays a very important role.
A healthy Head and Shoulders pattern usually follows this behavior:
- Strong buying volume during the uptrend.
- Highest volume around the Head.
- Lower volume while the Right Shoulder forms.
- High selling volume during the neckline breakdown.
Increasing volume during the breakout makes the signal more reliable.
How to Calculate the Target Price
After the neckline breaks, traders often estimate a target.
The process is simple.
- Measure the distance from theHead to theNeckline.
- Take the same distance downward from the breakout point.
That gives a rough downside target.
Remember, this is only an estimate—not a guarantee.
Always monitor price action along the way.
What Is the Inverse Head and Shoulders Pattern?
There is also a bullish version called theInverse Head and Shoulders Pattern.
Instead of appearing after an uptrend, it forms after a downtrend.
It has:
- Left Shoulder
- Head (lowest point)
- Right Shoulder
- Neckline
When the price breaks above the neckline, it may signal the beginning of a new uptrend.
Simple Trading Strategy
A basic approach could be:
✅ Wait for the neckline to break.
✅ Look for higher trading volume.
✅ Enter only after confirmation.
✅ Keep your stop-loss above the Right Shoulder.
✅ Book profits near the calculated target or important support levels.
Never enter just because the pattern "looks correct."
Common Mistakes Beginners Make
Many traders lose money because they:
- Trade before the neckline breaks.
- Ignore trading volume.
- Forget to place a stop-loss.
- Force the pattern where it doesn't exist.
- Ignore the overall market trend.
Patience is often more profitable than entering early.
Key Things to Remember
✔ Appears after an uptrend.
✔ Indicates a possible bearish reversal.
✔ Neckline break confirms the pattern.
✔ Volume should increase during the breakdown.
✔ Use proper risk management.
✔ Combine it with moving averages, RSI, MACD , support & resistance, and price action for better accuracy.

Disclaimer: This article is for educational purposes only and should not be considered investment advice. Always do your own research before investing or trading in the stock market.
Comments (0)
Be the first to comment.
About the author

NISM-Series-X-A Investment Adviser Level 1 examination completed
Amit writes about Indian equity markets, technical analysis, macro themes and the day-to-day mechanics of trading, with a focus on making the flow of global markets legible for retail investors. He has completed the NISM-Series-X-A Investment Adviser Level 1 examination.
You May Also Like

Big Tech Gains $750B as AI Data Centre Stocks Crash
Global Markets & Economy · Nov 5, 2026 · 12 min read
Big Tech Gains $750 Billion After US Midterms, but AI Data-Centre Stocks Crash: Is Wall Street Rewarding Less AI Spending? Key Takeaway: Wall Street's reaction to the 2026 US midterm elections has exposed a surprising divide in the artificial intelligence investment boom. Established technology giants rallied, with five major companies on course to add more than $750 billion…
Read more...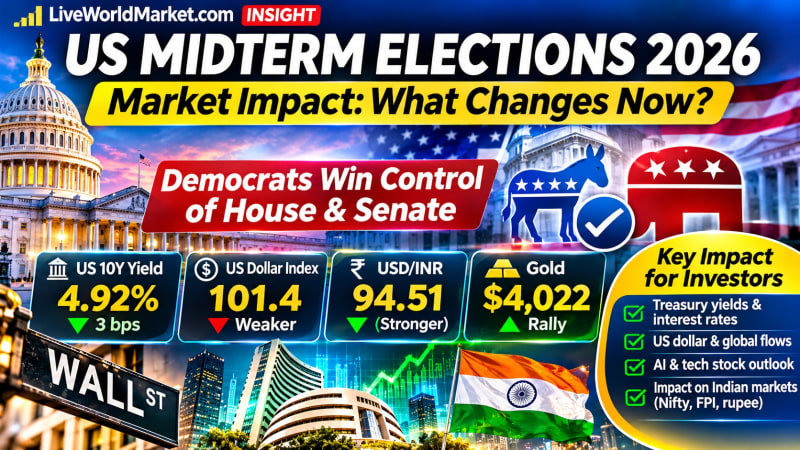
US Midterm Elections 2026: Impact on Stocks, Dollar & India
Global Markets & Economy · Nov 4, 2026 · 10 min read
US Midterm Elections 2026: Why Treasury Yields, the Dollar and Indian Stocks Could React More Than Wall Street Key Takeaway: Democrats have won control of both chambers of the US Congress in the 2026 midterm elections, creating a divided government under President Donald Trump. The immediate market reaction has been revealing: US Treasury yields declined, the dollar weakened…
Read more...
Apple Overtakes Nvidia: Is Lower AI Spending Winning?
Technology & Sectors · Nov 2, 2026 · 9 min read
Apple Overtakes Nvidia as World's Most Valuable Company Ahead of Earnings: Is Spending Less on AI Becoming Wall Street's Winning Strategy? Key takeaway: Apple has reclaimed the title of the world's most valuable publicly traded company, overtaking Nvidia as investors reassess the enormous cost of artificial intelligence infrastructure. With Apple's upcoming earnings in focus…
Read more...
ExxonMobil Refining Profits Surge: Impact on Indian Oil Stocks
Commodities & Energy · Nov 1, 2026 · 8 min read
ExxonMobil's Refining Profits Overtake Oil Drilling for First Time in 6 Years: Why India's Oil Stocks May Miss the Windfall Key Takeaway: ExxonMobil's refining business has emerged as a bigger earnings contributor than oil production, highlighting an extraordinary shift in global energy markets. But Indian oil companies such as IOC, BPCL and HPCL face a different challenge…
Read more...
Fed Decision and Microsoft–Google Earnings: Two Critical Tests for the AI Stock Market Rally
Global Markets & Economy · Oct 28, 2026 · 15 min read
Global stock markets are approaching one of the most important financial evenings of October 2026. The U.S. Federal Reserve is preparing to announce its latest interest-rate decision, while Microsoft and Alphabet, Google's parent company, are scheduled to publish quarterly earnings after Wall Street closes. These developments arrive as investors reassess the sustainability of…
Read more...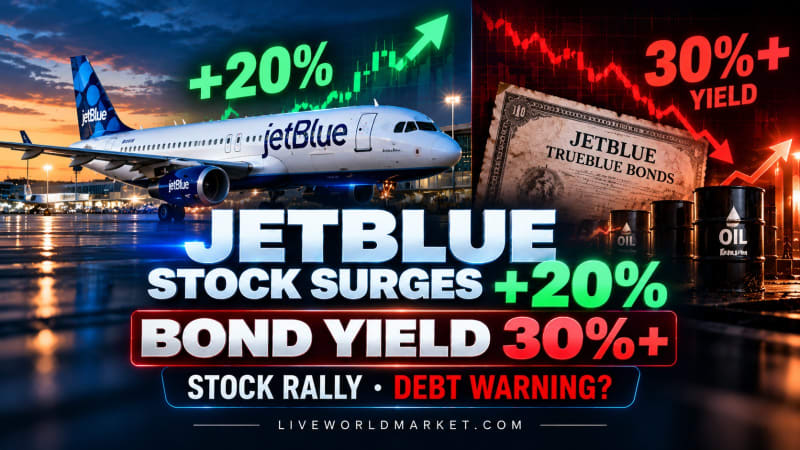
JetBlue Stock Surges 20%, Bond Yield Tops 30%: Warning?
Global Markets & Economy · Oct 28, 2026 · 16 min read
JetBlue Stock Surges 20% While Its Bonds Yield Over 30%: Is Airline Debt Flashing a Warning for Investors? Something unusual is happening in the U.S. airline industry. Shares of JetBlue Airways surged approximately 20% on October 27, after the airline raised its revenue outlook and attempted to reassure investors about its financial position. But an entirely different story…
Read more...
US Consumer Staples Rally 9.6%: FMCG Valuation Risk for India
Global Markets & Economy · Oct 25, 2026 · 16 min read
US Consumer Staples Surge 9.6% as Valuations Overtake Tech: Is the Safe-Stock Trade Becoming a Trap for Indian FMCG Investors? Something unexpected is happening on Wall Street. As investors become increasingly cautious about expensive artificial intelligence stocks, money has been moving into an unlikely market leader: consumer staples. The U.S. consumer-staples sector has…
Read more...
SpaceX 80,000 Cell Sites: Will Starlink Challenge Jio & Airtel?
Global Markets & Economy · Oct 24, 2026 · 17 min read
SpaceX's 80,000 Cell-Site Plan Sends US Telecom Stocks Down 8%: Could Starlink Disrupt Jio and Airtel Next? A major shift may be emerging in the global telecommunications industry—and Wall Street has already started reacting. Shares of American telecommunications giants AT&T and T-Mobile plunged nearly 8% on October 23 after reports revealed that Elon Musk's SpaceX was…
Read more...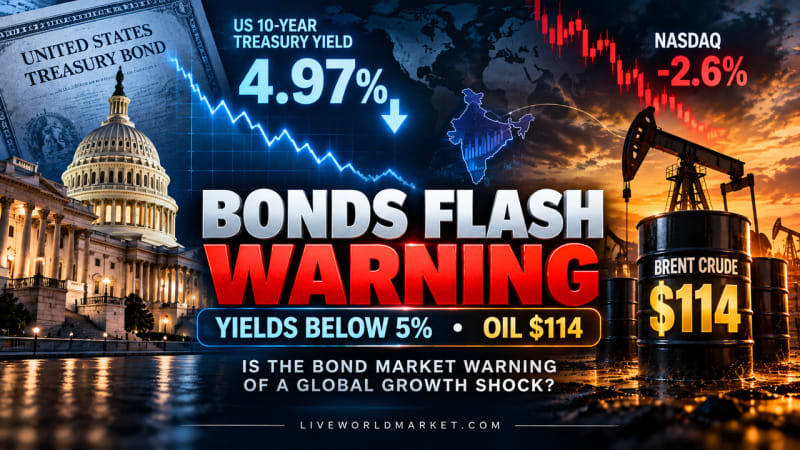
US 10-Year Treasury Yield Below 5%: Growth Shock Warning?
Central Banks & Rates · Oct 23, 2026 · 17 min read
US 10-Year Treasury Yield Falls Below 5% Despite $114 Oil: Is the Bond Market Warning of a Global Growth Shock? Something unusual is happening across global financial markets. The yield on the benchmark U.S. 10-year Treasury has fallen sharply below the psychologically important 5% level, even as Brent crude oil has surged toward $114 per barrel and technology stocks have…
Read more...
Brent Crude Tops $110: Impact on Indian Stocks & Earnings
Global Markets & Economy · Oct 22, 2026 · 14 min read
Brent Crude Tops $110: Why Indian Airlines, Paints and Tyre Stocks Face a Hidden Earnings Risk Brent crude oil has climbed above $110 per barrel, intensifying concerns that rising global energy prices could squeeze corporate profit margins, increase India's import costs and create further volatility in domestic equities. On October 22, Brent futures traded above $111 after…
Read more...