Advertisement
Discover more
Stock market analysis
Global market data
Real-time index tracking
Stock trading platform
Futures trading insights
GIFT Nifty reports

Liveworldmarket Editorial · Page 12

Insight — Market Notes & Analysis

Older research notes and market analysis from the Liveworldmarket team. Back to the latest posts.

technical··5 min read

Multiple Options Trading Strategies Explained in detail
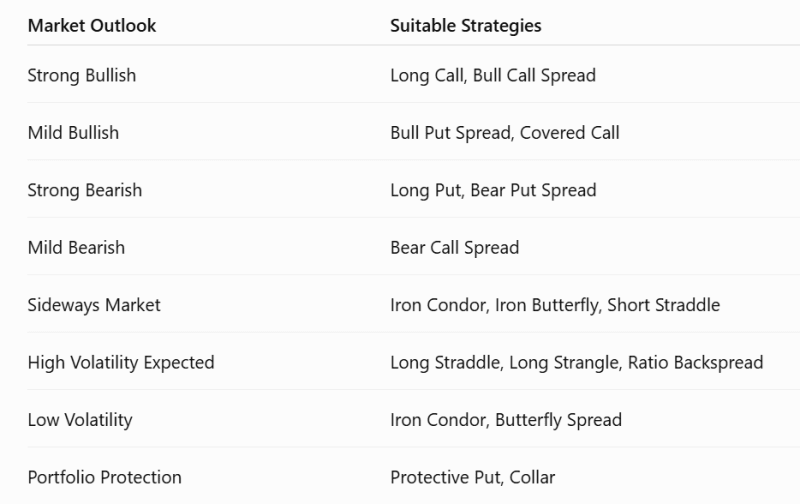
Multiple Options Trading Strategies Explained in detail

Options trading can look confusing at first, but every strategy is simply a way to express your market view while managing risk. Whether you expect the market to rise, fall, remain stable, or make a big move, there is an options strategy designed for that situation. The info graphic above groups - 20 popular option st…

Global market data

Read more...
fundamental··7 min read

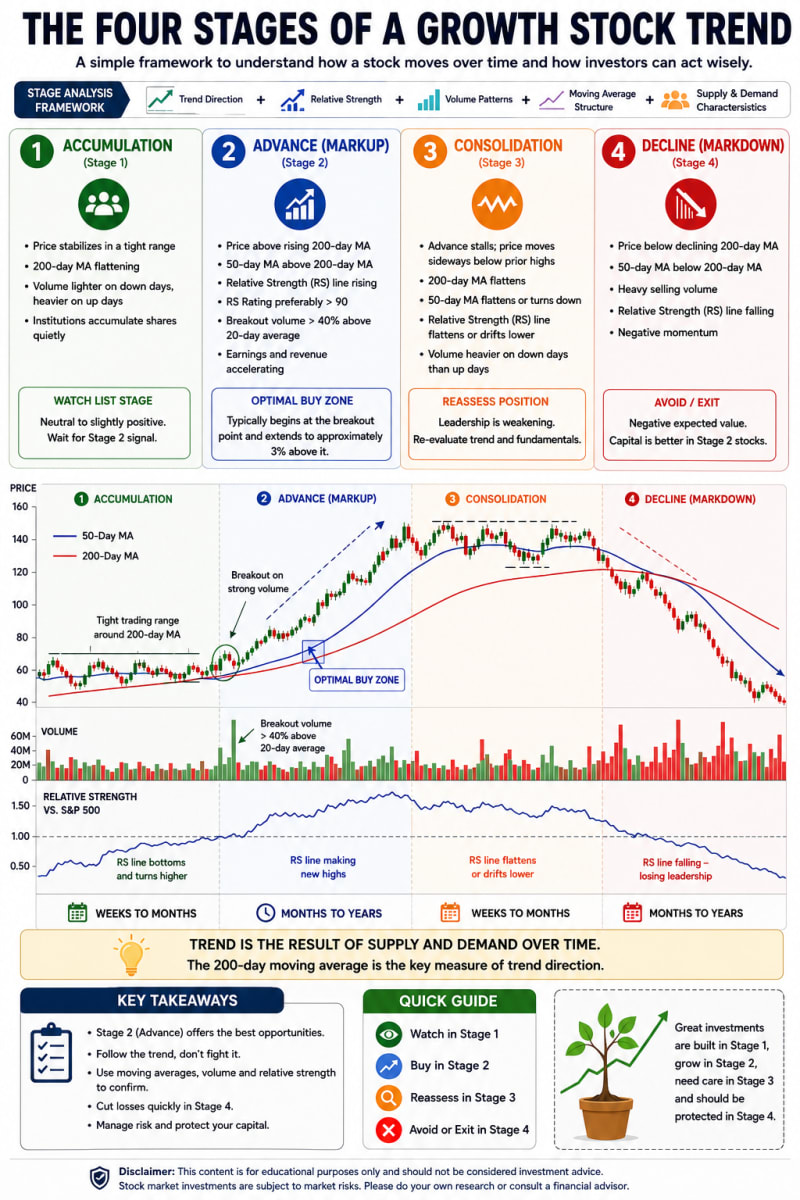
The Four Stages of a Growth Stock Trend: A Simple Guide for Investors

The Four Stages of a Growth Stock Trend: A Simple Guide for Investors

A strong stock does not move upward forever. Its price usually passes through different phases as buyers and sellers change their behaviour. Understanding these phases can help investors identify when a stock may be preparing for an upward move, when the trend is strong, when momentum is weakening and when risk is inc…

Read more...

technical··5 min read

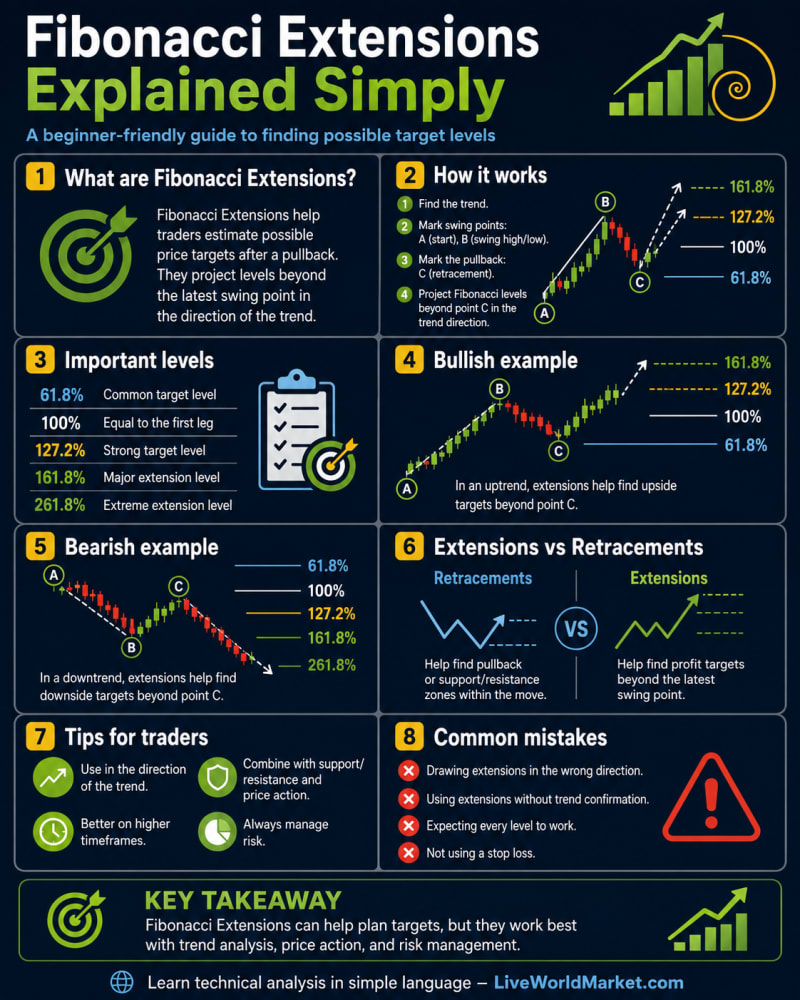
Fibonacci Extensions Explained: A Beginner's Guide to Finding Price Targets

Fibonacci Extensions Explained: A Beginner's Guide to Finding Price Targets

If you've ever wondered "How do traders estimate where a stock's price might go after a breakout?", the answer often lies in a powerful technical analysis tool called Fibonacci Extensions. Unlike Fibonacci retracement, which helps identify possible support and resistance during a pullback, Fibonacci Extensions are use…

Stock trading platform

Read more...

technical··5 min read

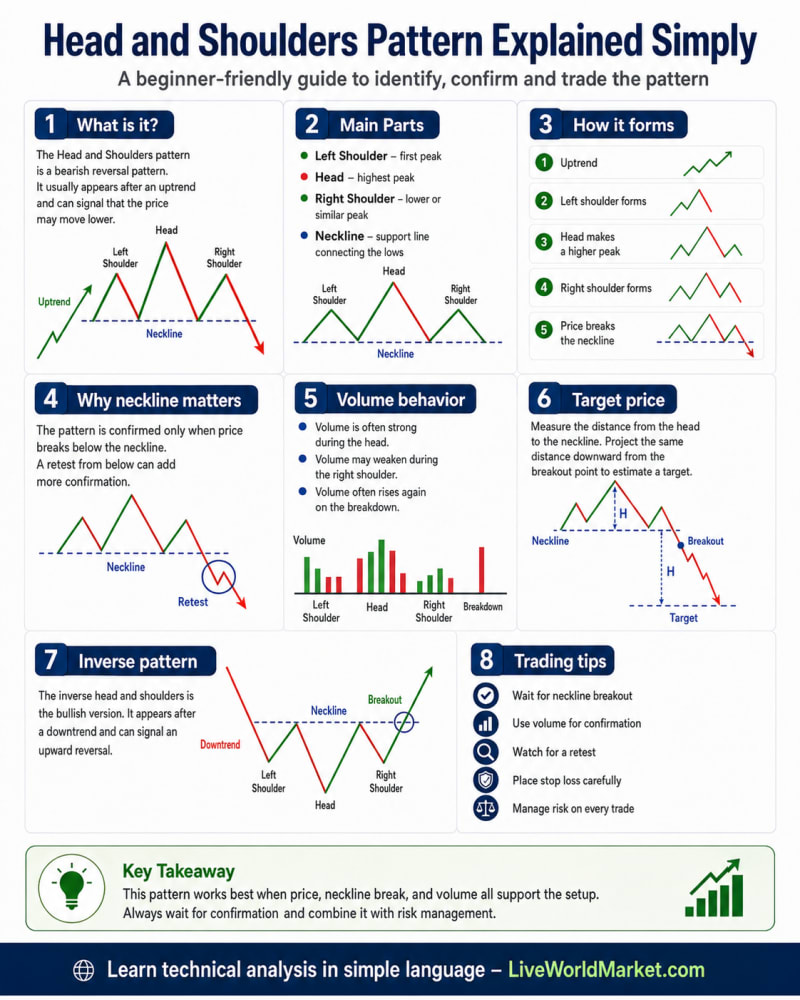
Head and Shoulders Pattern Explained: A Simple Guide for Every Trader

Head and Shoulders Pattern Explained: A Simple Guide for Every Trader

If you've ever looked at a stock chart and wondered how experienced traders identify trend reversals, the Head and Shoulders Pattern is one of the first chart patterns you should learn. It is easy to recognize and can help traders identify when an uptrend may be ending. However, this pattern should never be used alone…

Read more...

technical··6 min read

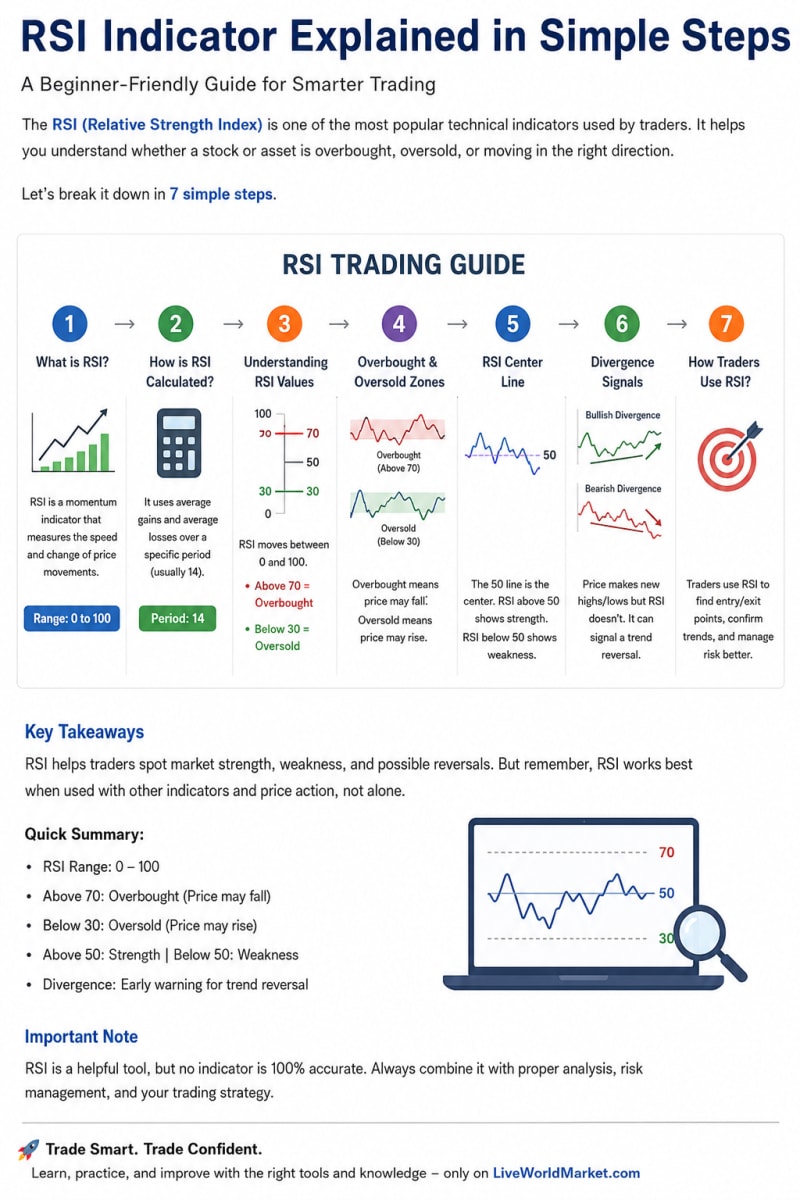
RSI Explained in Simple Words: A Beginner’s Guide to Reading Market Momentum

RSI Explained in Simple Words: A Beginner’s Guide to Reading Market Momentum

The Relative Strength Index (RSI) is one of the most popular technical indicators used by traders and investors. It helps users understand whether a stock is moving with strong buying momentum, strong selling pressure, or is trading in a neutral zone. RSI does not tell you the exact future price of a stock. Instead, i…

Real-time index tracking

Read more...

fundamental··6 min read

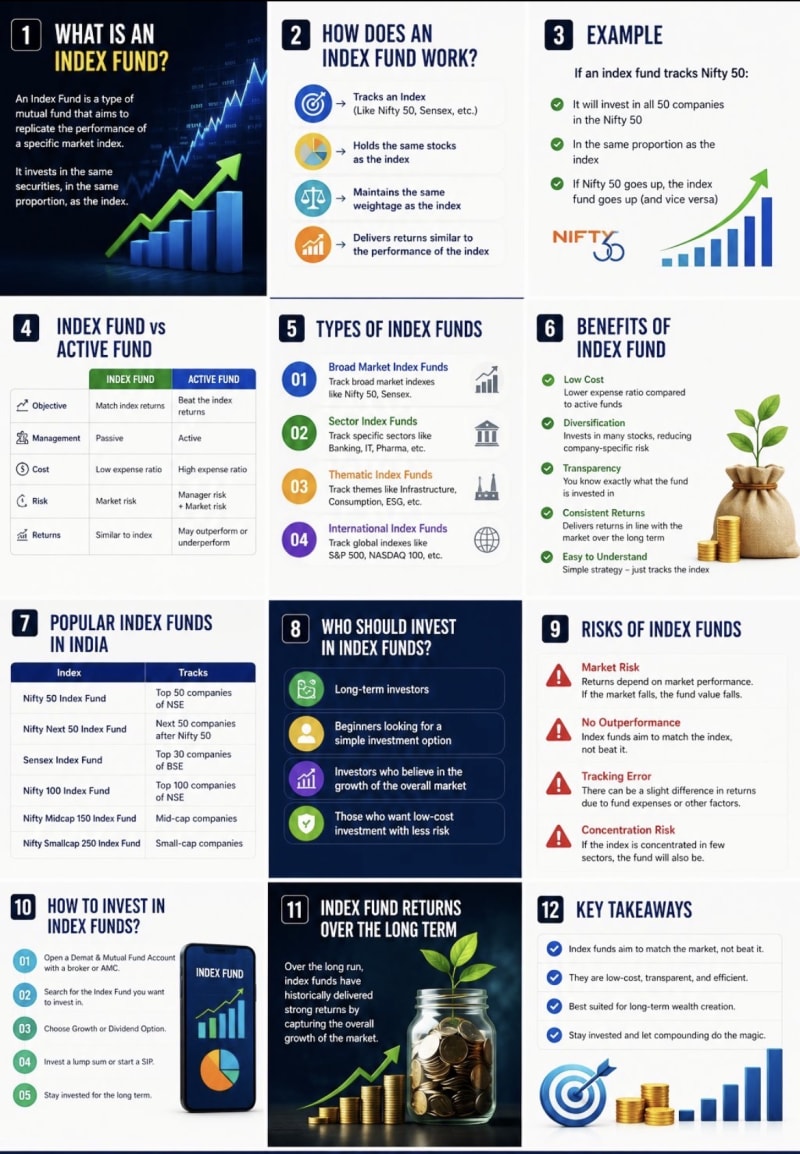
What Is an Index Fund? A Beginner's Guide to Smart Long-Term Investing

What Is an Index Fund? A Beginner's Guide to Smart Long-Term Investing

For many people, investing in the stock market feels complicated. With thousands of stocks to choose from, selecting the right companies can be overwhelming. This is where Index Funds offer a simple and effective solution. Instead of trying to beat the market by picking individual stocks, index funds aim to match the …

Read more...
Advertisement

news··7 min read

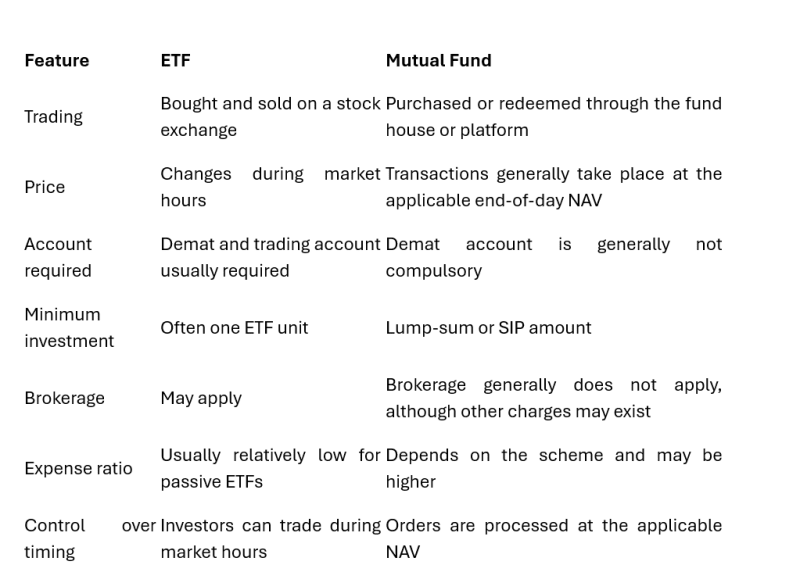
What Is an ETF? A Simple Guide to Exchange-Traded Funds for Beginners

What Is an ETF? A Simple Guide to Exchange-Traded Funds for Beginners

Exchange-Traded Funds, commonly known as ETFs, have become a popular investment option among Indian investors. They combine some of the benefits of mutual funds with the flexibility of buying and selling shares on a stock exchange. ETFs can be useful for beginners, long-term investors and cost-conscious investors who …

Read more...

news··7 min read

Crude Oil Near $90: Why Indian Markets Are Under Pressure

Published: July 21, 2026 Global crude oil prices have once again emerged as a major concern for Indian investors. Brent crude recently crossed the important $90-per-barrel level before settling close to $89 as markets reacted to escalating tensions in the Middle East and the possibility of disruptions to major oil-shi…

Read more...
Advertisement
Advertisement